To read weather maps for storm chasing, you’ll need to interpret surface maps, upper air charts, and Skew-T diagrams together. Surface maps reveal frontal positions and pressure gradients through isobar spacing, while upper air maps expose jet stream positioning and wind shear. Target warm sectors with CAPE above 2,000 J/kg, helicity exceeding 300 m²/s², and shear above 40 knots. Master these metrics together, and the full picture of what makes a dangerous tornado day becomes clear.
Key Takeaways
- Surface maps identify high and low-pressure systems, cold fronts, and warm fronts, revealing where severe weather is most likely to develop.
- Tightly packed isobars indicate strong pressure gradients and faster winds, helping storm chasers assess dangerous wind conditions quickly.
- Upper air maps expose jet stream positioning and wind shear, with values exceeding 30-40 knots supporting supercell development.
- Skew-T charts measure CAPE, CIN, and LCL height, quantifying atmospheric instability and identifying explosive convective potential.
- Targeting the warm sector with dewpoints above 65°F, CAPE exceeding 2,000 J/kg, and helicity above 300 m²/s² maximizes tornado probability.
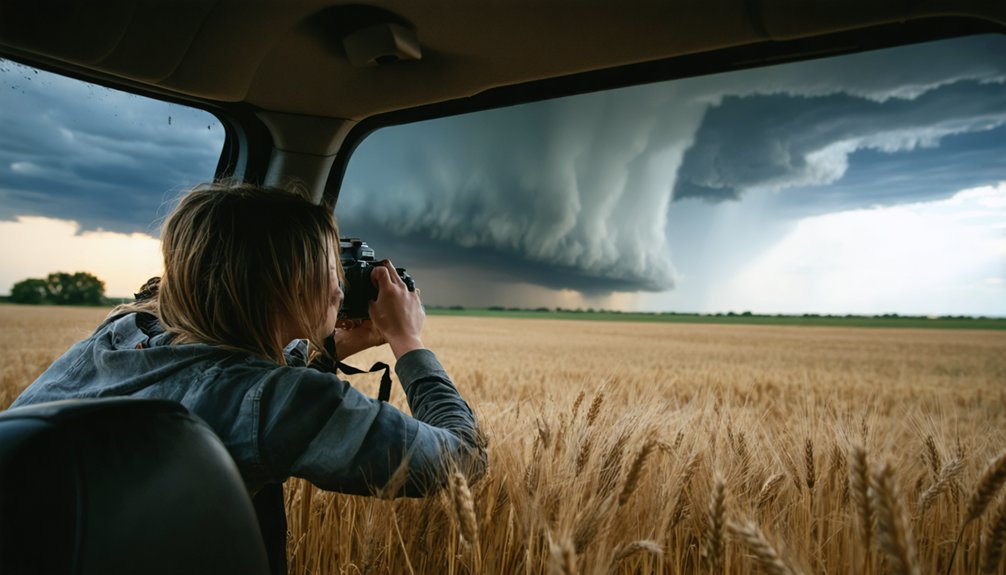
Why Weather Maps Are a Storm Chaser’s Most Important Tool
Weather maps aren’t just helpful for storm chasers — they’re essential. They give you real-time intelligence on pressure systems, fronts, moisture, and wind shear — every variable driving storm dynamics. Without them, you’re guessing. With them, you’re making calculated decisions about where severe weather will initiate, intensify, and move.
Surface maps reveal moisture boundaries and frontal positions. Upper air maps expose wind patterns aloft. Skew-T charts quantify instability and lift potential. Together, they form a complete atmospheric picture you can act on.
You don’t need to rely on someone else’s forecast. Reading these maps yourself puts the decision-making power directly in your hands. You choose the target. You assess the risk.
That’s the freedom situational awareness gives you — and weather maps are how you get it.
Surface Maps 101: Pressure, Fronts, and Wind Patterns
Surface maps are your first stop when evaluating severe weather potential. You’ll identify high-pressure systems (H) bringing cool, dry, stable air and low-pressure systems (L) driving warm, moist, unstable conditions — both critical for understanding storm dynamics.
Isobars connect equal-pressure points. Tight isobar spacing signals strong pressure gradients and stronger winds. Loose spacing indicates weaker flow.
Tightly packed isobars mean business — strong pressure gradients, stronger winds, and a weather pattern demanding your full attention.
Fronts define air mass boundaries. Cold fronts — blue lines with triangles — advance colder air aggressively, triggering sharp convective lines.
Warm fronts — red lines with semicircles — slope gradually, producing widespread clouds and rain ahead of warming air.
Stationary fronts signal prolonged moisture pooling, elevating flood risk.
When you analyze pressure systems together with frontal positions, you’ll quickly identify where lift, moisture, and instability converge — your prime severe weather target zone.
How to Read Isobars for Wind Speed and Direction
When you examine isobars on a surface map, you’ll notice that tightly packed lines signal a steep pressure gradient, which directly translates to stronger winds.
You can estimate wind speed by measuring the spacing between isobars—closer lines mean faster winds, while widely spaced lines indicate calmer conditions.
To determine wind direction, you’ll apply Buys Ballot’s Law: stand with the low pressure to your left in the Northern Hemisphere, and the wind flows roughly parallel to the isobars, slightly angled toward lower pressure due to surface friction.
Isobar Spacing Indicates Wind
Isobars — lines connecting points of equal atmospheric pressure — are among the most telling features on a surface weather map, and their spacing directly encodes wind speed.
When isobars pack tightly together, the pressure gradient is steep, driving stronger wind velocity across that zone. Widely spaced isobars signal a weak gradient and calmer conditions.
For accurate isobar interpretation, you’ll want to measure spacing relative to the map’s scale. A 4-millibar pressure difference compressed into a short distance can indicate winds exceeding 30–40 knots — supercell-supporting thresholds.
Conversely, loose spacing often means marginal shear environments unsuitable for organized convection.
Wind direction runs parallel to isobars in upper-level flow, but surface friction deflects winds slightly inward toward low pressure. Factor that in when evaluating your target area.
Reading Pressure Gradient Direction
Knowing how tightly isobars are spaced tells you wind speed, but extracting wind direction requires reading the pressure gradient‘s orientation. Wind flows from high to low pressure, but Earth’s rotation deflects it rightward in the Northern Hemisphere — a process called the Coriolis effect.
This means surface winds don’t cross isobars perpendicularly; they flow roughly parallel, counterclockwise around lows and clockwise around highs.
To determine wind direction, identify the pressure gradient by locating adjacent high and low pressure centers. Draw a mental perpendicular line across the isobars, then apply the Coriolis deflection.
On storm chasing days, you’ll use this technique to anticipate low-level inflow direction feeding thunderstorms. Accurate wind direction assessment directly informs your positioning relative to a storm’s updraft base.
Cold Fronts, Warm Fronts, and Where Severe Storms Form
Cold fronts and warm fronts aren’t just boundary lines on a map—they’re the primary triggers that force air upward and ignite severe weather.
Understanding cold front dynamics and warm front characteristics lets you pinpoint exactly where storms will fire.
Watch these four critical zones:
- Cold front boundary — Blue triangles mark advancing cold air undercutting warm, moist air, producing explosive lift and supercells.
- Warm front zone — Red semicircles indicate gradual warm air overriding cooler air, generating widespread clouds and steady precipitation.
- Warm sector — The region between both fronts concentrates dewpoints above 60°F and CAPE exceeding 2000 J/kg.
- Triple point — Where fronts intersect, convergence maximizes lift, making it your highest-probability target for tornado-producing storms.
What Upper Air Maps Tell You That Surface Maps Can’t

While surface maps reveal what’s happening at ground level, upper air maps expose the atmospheric mechanics driving storm development aloft—data you simply can’t extract from isobars and frontal boundaries alone.
Upper air dynamics show you jet stream positioning, trough locations, and temperature advection patterns that directly control storm initiation and intensification.
You’ll identify whether adequate wind shear exists across the 0-6 km layer—values exceeding 30-40 knots support supercell development.
Hodographs plot wind vectors at multiple altitudes, letting you assess rotational potential before storms even fire.
Troughs aloft enhance lift, destabilizing the atmosphere from above while surface boundaries destabilize it below.
Cross-referencing both map types gives you a complete vertical picture, letting you make precise targeting decisions rather than guessing based on surface data alone.
How to Read a Skew-T Chart for Storm Chasing
The Skew-T Log-P chart is your most powerful single-glance tool for evaluating atmospheric stability before storms fire.
Master skew t interpretation and you’ll assess storm stability independently, without relying on anyone else’s forecast.
Focus on these four critical parameters:
- CAPE — Values exceeding 2000 J/kg signal intense updraft potential; above 1000 J/kg is your baseline threshold.
- Lifted Index — Negative values confirm strong uplift; more negative means greater instability.
- CIN — Low convective inhibition allows surface parcels to break free and initiate storms.
- LCL Height — A low lifting condensation level means storms reach condensation quickly, supporting tornado-favorable structure.
Read these four together.
No single value tells the full story — their combination does.
The Surface Boundaries Where Supercells Are Born
When you scan a surface map, you’ll find supercell genesis tied directly to three critical boundaries: cold fronts, drylines, and warm sector moisture zones.
Cold fronts force sharp temperature and dewpoint contrasts, driving powerful lift where colliding air masses meet, while drylines separate moist Gulf air (dewpoints 60–70°F) from drier continental air, creating a volatile ignition zone for discrete supercell development.
You’ll want to identify the warm sector between these boundaries, where high dewpoints, strong instability (CAPE >2000 J/kg), and minimal CIN set the stage for explosive convective initiation.
Cold Front Storm Triggers
Cold fronts rank among the most reliable storm triggers on a surface weather map, and identifying them correctly can make or break your forecast.
Cold front dynamics drive sharp temperature contrasts, forcing warm, moist air upward and igniting storm initiation along the boundary.
Watch for these four key indicators:
- Tight isobar spacing — confirms strong pressure gradient and gusty winds
- Dewpoint drop — sharp decrease behind the front signals drier, cooler air intrusion
- Wind shift — veering winds from south/southwest to northwest confirm frontal passage
- CAPE values — look for readings exceeding 2,000 J/kg ahead of the front
You’re targeting the warm sector just ahead of the front, where instability and moisture peak.
Dryline Boundaries Explained
While cold fronts force lift through sharp temperature contrasts, drylines trigger supercells through a different mechanism — moisture discontinuity.
You’re looking at a boundary separating moist Gulf air from dry desert air originating in the Southwest.
Dryline characteristics include dramatic dewpoint drops — sometimes 30°F within miles.
On surface maps, you’ll identify drylines as dashed lines, often positioned across Texas, Oklahoma, and Kansas during spring.
Moisture gradients tighten throughout the afternoon as surface heating intensifies convergence along the boundary.
This convergence forces air parcels upward, initiating convection where CAPE values frequently exceed 3000 J/kg.
Watch for dryline eastward bulges — these focal points concentrate shear and instability, making them prime supercell initiation zones.
Target these boundaries precisely.
Warm Sector Moisture Zones
Nestled between cold and warm fronts, the warm sector delivers the explosive combination of ingredients supercells demand. Moisture sources like the Gulf of Mexico pump dewpoints into the 60–70°F range, fueling unstable, primed air masses.
Scan your surface map for these four warm sector markers:
- Dewpoint readings of 65°F+ indicating deep moisture pooling
- CAPE values exceeding 2,000 J/kg confirming intense instability
- Wind vectors backing from southerly flow, maximizing helicity above 300 m²/s²
- Isobar spacing revealing pressure gradients that accelerate surface inflow
You’re targeting the zone where moisture, instability, and shear converge.
That intersection is exactly where supercells initiate, grow, and produce violent weather.
CAPE, Shear, and Helicity: The Numbers That Define a Tornado Day
Three numbers define whether a day has tornado potential: CAPE, wind shear, and helicity.
You’ll read CAPE values exceeding 2,000 J/kg as strong instability indicators, signaling intense updrafts across atmospheric layers. Shear profiles matter equally — 0-6 km shear surpassing 40 knots supports supercell storm dynamics and organized rotation.
Helicity thresholds above 300 m²/s² dramatically elevate tornado formation probability.
Cross-reference these metrics during moisture assessment, confirming dewpoints between 60-70°F to validate favorable conditions. Together, these parameters sharpen storm prediction accuracy and refine chaser strategies before you deploy.
Check SPC Mesoscale Analysis for real-time data combining all three. When CAPE, shear, and helicity simultaneously reach critical values, you’ve identified a legitimate tornado day worth intercepting.
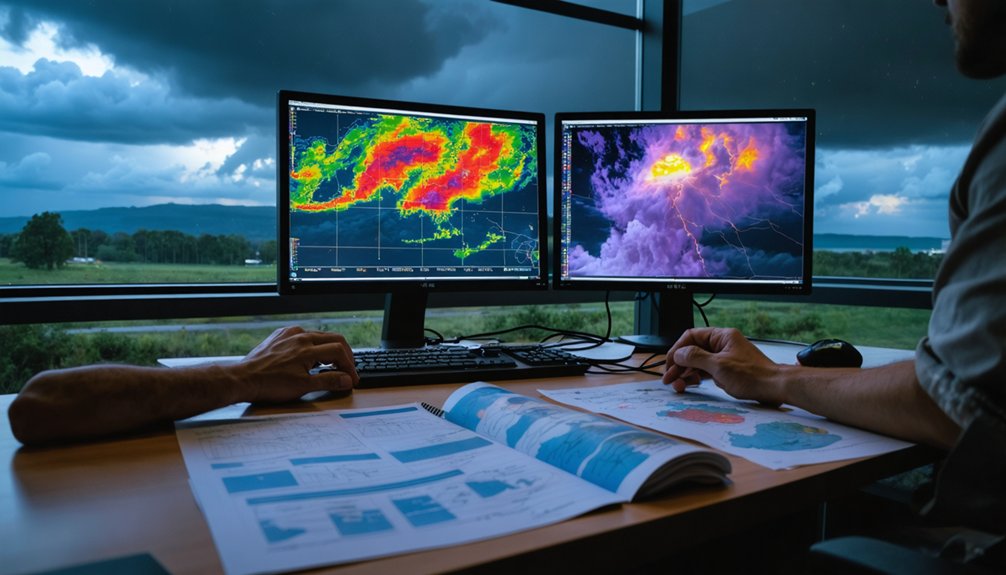
Real-Time Weather Map Tools Storm Chasers Rely On
Several real-time tools define a modern storm chaser’s workflow, each delivering critical data layers you can’t afford to miss.
Combining these resources sharpens your storm tracking precision and keeps you mobile and informed.
- SPC Mesoscale Analysis – Plots CAPE, shear, and helicity across target regions, updated hourly.
- Real time radar (RadarScope or GR2Analyst) – Reveals velocity couplets, hook echoes, and rotation signatures at high resolution.
- Surface Analysis Maps – Track dewpoint boundaries, drylines, and frontal positions driving storm initiation.
- Upper Air/Hodograph Tools (SPC Sounding Analysis) – Assess wind shear profiles and storm rotation potential aloft.
Cross-referencing these platforms simultaneously gives you the situational awareness needed to intercept storms safely and decisively.
How to Build a Complete Pre-Chase Weather Map Briefing
Before you commit to a target area, you need a structured briefing that layers synoptic, mesoscale, and thermodynamic data into a single coherent picture.
Start with surface maps to identify fronts, drylines, and pressure gradients driving storm patterns. Then shift to upper air maps to assess jet stream positioning, wind shear, and troughs enhancing lift.
Pull your Skew-T Log-P charts to confirm CAPE, CIN, and LCL values supporting initiation. Flag any weather anomalies—unexpected moisture surges, capping inversions, or shear misalignments—that could invalidate your target.
Cross-reference SPC Mesoscale Analysis for real-time parameter updates. Document your dewpoints, helicity values, and 0-6 km shear numbers before moving.
A disciplined, sequential briefing keeps your decisions grounded in data, not guesswork, giving you maximum freedom to chase effectively and safely.
Frequently Asked Questions
How Do Occluded Fronts Affect Storm Chasing Safety and Route Planning?
When you’re chasing near occluded fronts, you’ll notice declining storm intensity as warm sectors diminish. Reroute quickly, since storms lose supercell structure. Monitor radar continuously, adjust your escape routes, and prioritize exits over target selection to maintain safety.
Can Storm Chasing Be Done Safely Without Access to Real-Time Radar?
Over 70% of storm fatalities involve poor situational awareness. You can’t guarantee storm preparedness or safe navigation without real-time radar—it’s your critical data lifeline, tracking rotation, velocity couplets, and hook echoes that keep you alive and free.
What Role Do Stationary Fronts Play in Multi-Day Flooding Event Forecasting?
Stationary front characteristics drive flooding event prediction by stalling moisture flow over one region for days. You’ll track alternating symbols and parallel winds on maps, as persistent rain accumulates, greatly elevating multi-day flood risks.
How Does the Dryline Position Shift Throughout a Typical Storm Chasing Day?
Like a slow tide rolling in, the dryline’s dryline dynamics shift eastward as daytime heating intensifies. You’ll track moisture convergence building westward boundaries, typically surging 50-100 miles east by peak afternoon instability hours.
What Weather Map Indicators Suggest a Tornado Has Already Touched Down?
You’ll spot tornado indicators through radar’s velocity couplets and hook echo storm signatures. Watch for tight isobars, surface pressure drops, and spotter reports confirming rotation. These real-time data points confirm an active touchdown event.
References
- https://www.youtube.com/watch?v=5x844y5tOVU
- https://stormtrack.org/threads/the-complete-guide-to-storm-chasing-storm-chasing-guide-for-new-or-newer-chasers.25247/
- https://www.stormchasingusa.com/blog/learning-the-basics-about-tornadic-storm-forecasting/
- https://www.youtube.com/watch?v=GkE3F5AuWBQ
- http://www.nwclimate.org/guides/weather-charts-tutorial/
- https://www.weather.gov/media/bis/Weather_Spotter_Field_Guide.pdf
- https://www.nesdis.noaa.gov/about/k-12-education/weather-forecasting/how-read-weather-map
- https://www.weathergraphics.com/chasing/