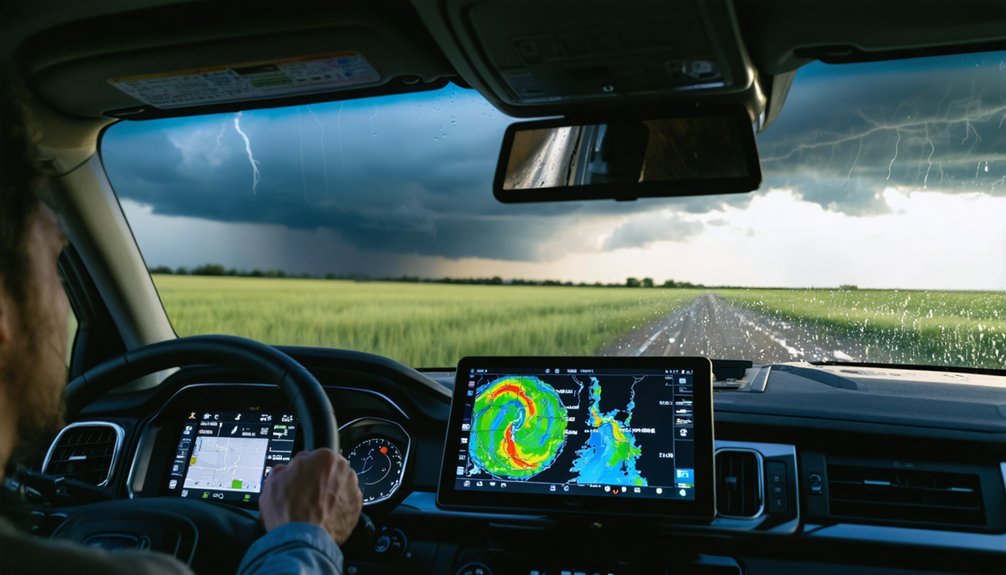
You’ll maximize storm interception success by synthesizing satellite imagery with multi-model ensemble forecasts (GFS, NAM, HRRR) to identify convective initiation 30-45 minutes before radar detection. Monitor infrared channels for cooling cloud tops while targeting dryline-warm front intersections where CAPE exceeds 2000 J/kg and STP values surpass 3. Deploy mobile X-band Doppler systems to detect mesocyclone velocity couplets showing gate-to-gate shear above 25 m/s. Integrate weather balloon soundings with vehicle-mounted sensors for ground-truth validation. Advanced techniques below reveal how precision positioning transforms forecast parameters into actionable intercept corridors.
Key Takeaways
- Use satellite imagery to detect early convective development by monitoring cooling cloud tops and towering cumulus before radar detection.
- Analyze multi-model ensembles like GFS, NAM, and HRRR to identify regions with CAPE exceeding 2000 J/kg and favorable shear parameters.
- Deploy mobile X-band Doppler radar systems to detect mesocyclones showing velocity couplets with gate-to-gate shear exceeding 25 m/s.
- Target boundary intersections with wind shift convergence zones exhibiting 30-40 knot boundary-parallel flow for supercell development.
- Collect ground-level atmospheric data using weather balloons and instrumented vehicles to validate remote sensing observations in real-time.
Identifying Early Convective Development Through Satellite Imagery
When tracking atmospheric conditions before radar can detect precipitation echoes, satellite imagery provides critical early warning of convective development through multiple spectral channels.
You’ll detect towering cumulus clouds in visible high-resolution imagery, signaling convective initiation along boundaries. Infrared channels reveal cooling cloud tops, confirming strengthening updrafts that correlate with atmospheric sounding interpretations.
Day Cloud Phase RGB enhances contrast for tracking overshooting tops and proximal cumulonimbus structures before precipitation appears on radar. You’ll observe persistent cumulus attempts evolving into successful storm formation, with textural differences highlighting instability.
Shadows and highlights expose early updraft development, while little orphan anvils indicate short-lived convective cycles. GOES satellite layers identify storm development timing, giving you 10-20 minutes’ advantage for positioning decisions when chasing severe weather events.
Leveraging Weather Models and Convective Outlooks for Target Selection
You’ll maximize chase success by synthesizing GFS, NAM, and HRRR ensemble forecasts with SPC Day 2-3 outlooks to identify regions where modeled CAPE exceeds 2000 J/kg and STP values surpass 3.
Your target refinement demands precise identification of dryline-warm front intersections where model soundings indicate backed surface winds and storm-relative helicity concentrations above 150 m²/s².
Strategic route planning requires positioning 50-75 miles southeast of forecasted initiation points along boundaries exhibiting 5% or higher tornado probabilities, ensuring intercept angles that account for predicted supercell motion vectors of 20-40 mph.
Multi-Model Ensemble Analysis
As storm chasers extend their forecast horizon beyond 48 hours, multi-model ensemble analysis becomes the cornerstone of reliable target selection by systematically reducing bias and uncertainty through comparative evaluation of numerous atmospheric simulations.
You’ll leverage GEFS and EPS outputs for ensemble model comparison, identifying skeletal patterns of trough placement and moisture return that signal potential chase setups. Ensemble spread visualization through spaghetti plots reveals forecast confidence—tight clustering indicates robust agreement, while divergent solutions demand cautious interpretation.
Larger multimodel ensembles consistently outperform single-model solutions across all meteorological parameters, providing superior statistical reliability for long-range targeting decisions. You’ll apply fuzzy clustering methodology and EOF pattern analysis to objectively separate forecast scenarios, quantifying cyclone intensity variations and position uncertainties relative to ensemble mean solutions for ideal chase day targeting.
Identifying Boundary Intersections
Boundary intersections represent geometric convergence zones where atmospheric discontinuities—outflow boundaries, dry lines, warm fronts, and stationary fronts—create localized maxima in low-level vorticity and vertical motion, establishing preferential nucleation sites for supercell development. Your boundary placement strategies demand integrating surface analysis with mesoanalysis fields to pinpoint these critical zones.
Monitoring intersection evolution requires continuous radar surveillance combined with mobile mesonet data to track temporal changes in ideal convergence intensity.
Operational intersection identification protocols:
- Deploy multi-layer surface plots revealing wind shift lines converging at acute angles
- Analyze low-level shear vectors perpendicular to boundaries for prime storm-relative helicity enhancement
- Target intersections exhibiting 30-40 knot boundary-parallel flow preventing excessive storm deviation
- Prioritize subtle boundary configurations avoiding parallel shear vectors producing disorganized convective modes
- Integrate convective outlooks highlighting moderate risk corridors with persistent intersection structures
Route Planning Logistics
Strategic route planning begins 3-7 days before chase operations through systematic analysis of Storm Prediction Center convective outlooks and numerical weather prediction models. You’ll monitor GFS, NAM, and HRRR outputs to identify CAPE, shear vectors, and helicity parameters signaling supercell potential. Precipitation forecasting refines your initial target zone within high-risk areas like Kansas or Oklahoma’s dryline convergence regions.
Terrain analysis determines ideal positioning routes—avoiding north-crossing maneuvers that trap you in a storm’s path. You’ll incorporate road network density, fuel station locations, and escape corridors into your logistics framework. Earl Barker’s Severe Weather Parameters and COD forecast models provide visualization tools for parameter thresholds. Once mobile, you’ll shift from model-dependent forecasting to observational data prioritization, utilizing surface obs, visible satellite imagery, and SPC mesoanalysis for real-time boundary identification and storm mode assessment.
Using Radar Products to Detect Boundaries and Storm Initiation
Radar products reveal critical pre-storm environments through fine line boundaries appearing as stationary, narrow reflectivity features on base scans, often originating from nocturnal convective complexes. You’ll monitor echotops growth patterns using the 18 dBZ threshold between 5,000-70,000 feet to quantify updraft intensity and vertical development rates at initiation points.
Low-level vorticity signatures emerge through storm-relative velocity analysis, where couplets measuring 2-6 miles diameter indicate mesocyclone formation before visible funnel development.
Identifying Fine Line Boundaries
When collapsing thunderstorms generate outflow, the resulting boundaries manifest on radar as thin arcs or lines of weak reflectivity—a signature created by converging winds concentrating airborne particles such as insects, dust, and water droplets along the convergence zone. You’ll detect these fine lines through velocity field anomaly detection, revealing wind convergence patterns critical for forecasting storm development.
Boundary intersections analysis becomes essential when targeting high-probability convective initiation zones.
Key Fine Line Detection Strategies:
- Monitor reflectivity products for thin, arc-shaped echoes pushing outward from dissipating storms
- Employ velocity products to identify convergent wind signatures and intricate boundary structure
- Track persistent boundaries traveling hundreds of kilometers over 24+ hours
- Analyze boundary intersections with fronts, dry lines, or other outflows for maximum storm potential
- Combine radar data with surface observations and satellite imagery for precise boundary positioning
Monitoring Echotops Growth Patterns
Beyond detecting boundaries at the surface, you’ll track vertical development by monitoring echotops—the maximum height where precipitation echoes exceed 18 dBZ between 5,000 and 70,000 feet above radar level. This metric reveals updraft intensity before surface precipitation arrives, with severe setups typically displaying 30,000 to 40,000+ feet.
Analyzing height trends over time distinguishes strengthening cells from weakening ones. Rising values signal growing convection and intensifying updrafts, while monitoring for collapsing tops identifies storms losing momentum. Compare sequential scans to detect these changes rapidly.
You’ll achieve ideal readings by selecting distant radar sites rather than those directly beneath storms, where low elevation angles underestimate true heights. Enhanced echotops products pinpoint which cells warrant continued surveillance based on their vertical development trajectory.
Detecting Low-Level Vorticity Signatures
As convective cells mature, you’ll identify rotation signatures by analyzing low-level mesocyclones—storm-scale cyclonic circulations spanning 2-10 km in diameter with vertical depths near 3 km and rotational velocities exceeding 15 m/s. Rapid mesocyclone identification requires examining Doppler velocity couplets where inbound/outbound flows indicate cyclonic shear.
The Mesocyclone Detection Algorithm quantifies rotation strength, depth, and persistence across volume scans. Low level vorticity forecasting depends on environmental parameters: 0-1 km directional shear, boundary layer humidity, and CAPE distribution.
Critical Detection Parameters:
- Monitor velocity couplets showing gate-to-gate shear exceeding 25 m/s
- Verify persistence through two consecutive radar volume scans
- Locate circulation near RFD-updraft interface
- Assess 0-1 km environmental shear magnitude
- Distinguish mesocyclone rotation from broader Tornado Vortex Signatures
Deploying Mobile and Truck-Mounted Radar Systems for Real-Time Analysis
Mobile radar systems have revolutionized severe weather observation by enabling researchers and meteorologists to position high-resolution X-band Doppler radar directly in the path of developing storms. You’ll deploy these truck-mounted units to capture low-altitude atmospheric data below fixed WSR-88D beam heights, detecting debris signatures that confirm tornado touchdowns in real-time.
The dual-polarization technology distinguishes precipitation from non-meteorological targets while analyzing particle shapes for hydro-meteor classification. Your vehicle’s sensor redundancy guarantees continuous operation through redundant IP-controlled systems and cellular bonding networks.
On site power generation via patented VIP® systems powers dual equipment racks supporting HVAC, KA/KU satellite communications, and 360° camera arrays. These ruggedized platforms fill critical gaps in fixed radar networks, providing you unprecedented mobility to track rotating supercells and analyze velocity couplets wherever storms develop.
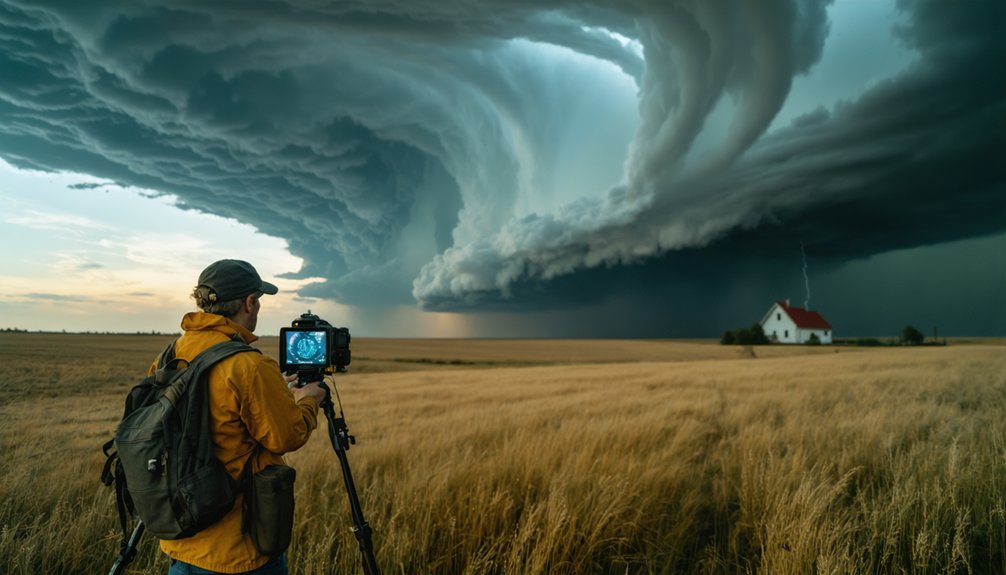
Collecting Ground-Level Data With Weather Balloons and Instrumented Vehicles
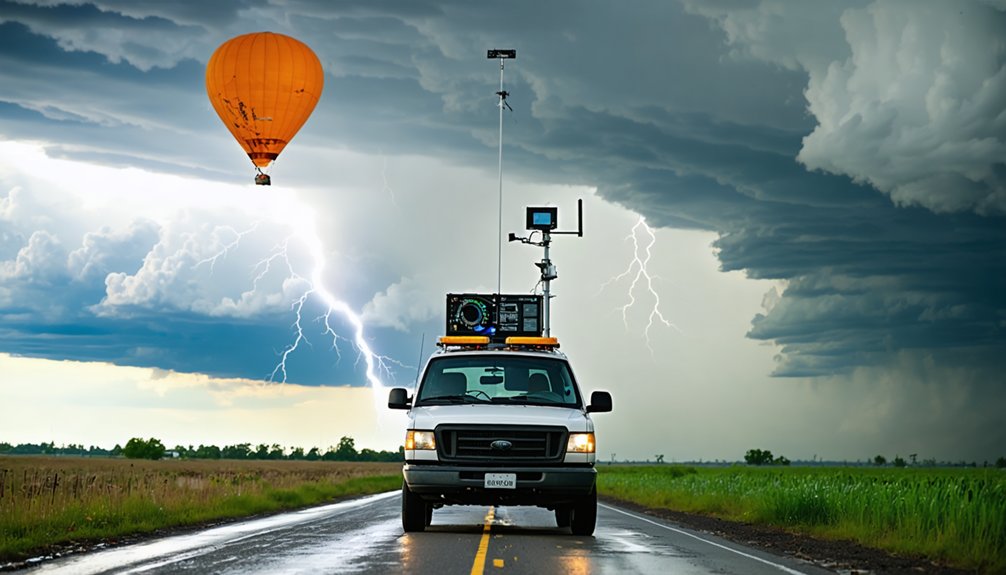
While truck-mounted radar systems capture precipitation patterns aloft, weather balloons and instrumented vehicles collect complementary ground-level observations that reveal the atmospheric conditions driving tornado development. You’ll launch balloons to measure temperature, humidity, and pressure throughout the vertical column, documenting debris signatures and observing low level thermodynamic profiles within the lowest kilometer.
Your vehicle-mounted sensors detect pressure drops, correlate lightning activity with power grid anomalies, and capture geotagged video for AI-assisted funnel identification.
Ground-Level Data Collection Protocol:
- Mount cameras on tripods with foreground landmarks for terrestrial photogrammetry analysis
- Record odometer readings from intersections for precise unpaved road positioning
- Deploy smartphone barometers to detect temporary pressure fluctuations outside vortex centers
- Geotag all imagery with EXIF data for radar comparison and storm position verification
- Document hail size, wind damage, and precipitation as ground truth for remote sensing validation
Monitoring Atmospheric Conditions With Stationary Sensor Arrays
Stationary sensor arrays establish persistent monitoring networks that capture atmospheric baseline conditions and detect rapid changes associated with severe weather events.
You’ll maximize coverage through deployment configuration optimization, positioning multipollutant monitors in strategic fence-line patterns that span several km² using networked optical scanning systems with retro-reflecting mirrors. Your sensors collect gaseous pollutant data every 10 seconds while PM sensors average measurements every 1-15 minutes, providing second-level temporal resolution for storm cell tracking.
Multi sensor calibration techniques require zeroing functions, span calibration with standard cylinders, and machine learning algorithms that adjust for humidity-temperature variations during field operation. Temperature, pressure, and humidity measurements enable real-time atmospheric corrections, while hybrid systems integrate reference-grade and low-cost sensors to deliver widespread, accurate pollutant mapping across dynamic meteorological conditions.
Integrating High-Resolution Radar Apps for Enhanced Storm Tracking
Modern storm chasing operations augment fixed atmospheric monitoring infrastructure with mobile high-resolution radar applications that process raw National Weather Service data directly on handheld devices. These systems enable radar data fusion from multiple sources, creating multi radar composites that eliminate coverage gaps and processing delays inherent in server-dependent platforms.
You’ll access dual-polarization products, velocity data, and vertically integrated liquid calculations with single-site resolution capabilities that match professional forecaster tools.
Critical integration capabilities include:
- Real-time processing of reflectivity, velocity, and dual-polarization parameters for thorough storm cell characterization
- Customizable animation frames and smoothing algorithms optimized for specific tracking scenarios
- National Weather Service alert integration with GPS-specific precipitation timing notifications
- Multi-layered environmental overlays including wind streams, temperature gradients, and lightning detection
- Storm component identification systems tracking rotation signatures, hail zones, and precipitation rates for predictive analysis
Maintaining Connectivity With Mobile Internet and GPS Technology
Because storm chasing operations demand uninterrupted data access in environments where cellular infrastructure experiences systematic degradation, you’ll need redundant connectivity architectures that combine multiple carrier networks with bonding hardware and signal amplification systems.
Deploy multi-carrier data plans spanning Verizon, AT&T, T-Mobile, and regional providers, utilizing packet-level bonding through Speedfusion technology for automatic network failover planning. The Fusion2Go 3.0 amplifies signals across all US carriers simultaneously, delivering 2X performance improvements in degraded signal zones.
High-gain window-mounted antennas with quad-element arrays (GPS, WiFi, dual LTE) integrate with BR1 Mini routers for optimal multi device management. Supplement cellular infrastructure with Starlink satellite systems, maintaining operational connectivity beyond 5 miles from precipitation cores.
This layered approach guarantees continuous radar streaming, NWS communication, and real-time meteorological data acquisition throughout 5000-mile chase deployments.
Utilizing AI and Crowdsourced Data Networks for Rapid Storm Assessment
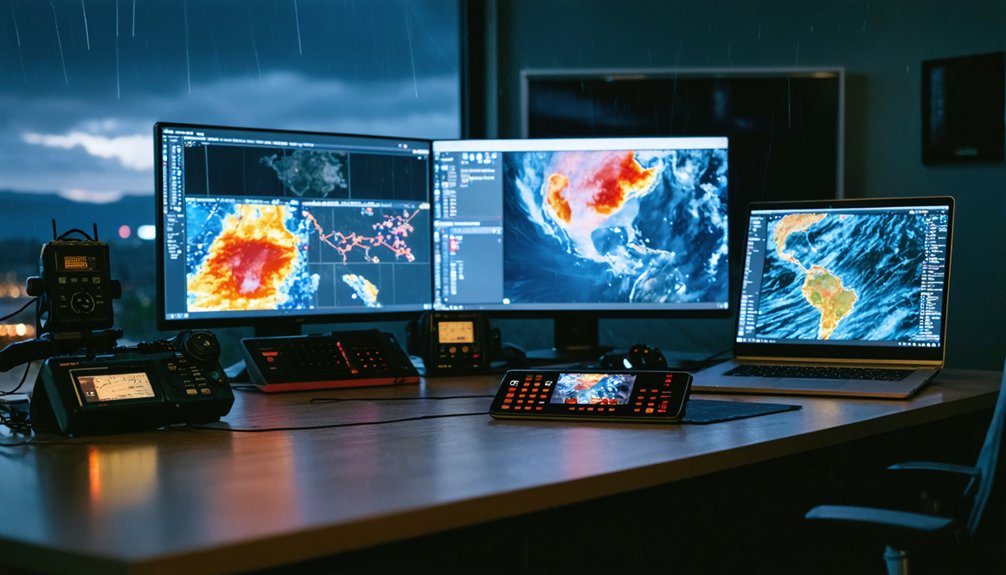
Artificial intelligence frameworks have revolutionized storm assessment protocols by processing atmospheric variables—sea surface temperatures, wind shear patterns, pressure gradients—through deep learning architectures that identify intensification signatures imperceptible to conventional analysis. You’ll achieve 20-25% track error reduction in 5-day forecasts while identifying predictive atmospheric signatures that signal rapid intensification events.
These systems deliver forecasts in minutes using single TPU/GPU units, enabling autonomous decision-making without supercomputer dependence.
Crowdsourced data networks enhance your assessment capabilities:
- Real-time camera imagery processing deduces flood intensity post-hurricane
- Observed surge data validates AI predictions against actual conditions
- Integration platforms like PRATUS provide immediate decision-support tools
- Historic and synthetic training datasets enable forecasting storm intensification trends in data-sparse regions
- 20-meter resolution inundation maps identify street-level risk exposure
You’ll generate actionable intelligence faster than traditional meteorological centers.
Frequently Asked Questions
What Are the Most Common Safety Protocols When Chasing Severe Storms?
You’ll need to prioritize maintaining situational awareness while adhering to weather advisories. Monitor radar data continuously, avoid core-punching through precipitation, seek sturdy shelter when threatened, and establish escape routes before storms intensify to dangerous levels.
How Much Does Basic Storm Chasing Equipment Typically Cost?
Breaking the bank isn’t necessary—you’ll spend $200-$300 for basic storm chasing equipment: weather radio ($40), GPS unit ($100), state maps ($20), compass ($10), emergency kit ($20). Equipment durability varies, but equipment costs escalate substantially with advanced sensors.
What Training or Certification Is Needed to Become a Storm Chaser?
No formal storm chaser qualifications exist; you’re free to pursue storms independently. However, completing severe weather coursework like SKYWARN training provides essential meteorological knowledge, safety protocols, and reporting skills that’ll greatly enhance your effectiveness and survivability.
How Do Storm Chasers Coordinate With Emergency Management and Local Authorities?
You’ll coordinate through real-time communication networks using ham radio and NOAA Weather Radio, reporting severe conditions directly to NWS meteorologists. Your coordination strategies include pre-deploying IMAT teams, activating emergency sirens, and providing field verification data to authorities.
What Are the Legal Requirements for Deploying Equipment on Public Roads?
You’ll need local permits for equipment deployment, though enforcement remains minimal. Adhering to road regulations prevents liability issues—violations carry standard penalties. Oklahoma’s proposed exemptions demonstrate lawmakers recognize chasers’ operational constraints, yet existing traffic codes still apply universally.