Examining satellite images is essential for successful storm chasing, enabling us to examine different weather elements with precision. We utilize visible images for detailed cloud formations and infrared images to measure thermal radiation, determining storm intensity. Water vapor images showcase moisture levels necessary for analyzing storm formation. By evaluating cloud formations, speed vectors, and temperature changes, we can monitor storm systems and forecast their paths accurately. Observing precipitation via radar reflectivity and cloud microphysics also improves our predictions. These data-driven strategies improve our capacity to intercept storms efficiently. For more in-depth information on these approaches, further details are provided.
Key Points
- Visible imagery shows detailed cloud formations and storm tracking.
- Infrared imagery reveals storm intensity via thermal radiation.
- Water vapor imagery highlights moisture content for storm analysis.
- Doppler radar and scatterometer readings provide real-time wind speed and direction.
Types of Satellite Imagery
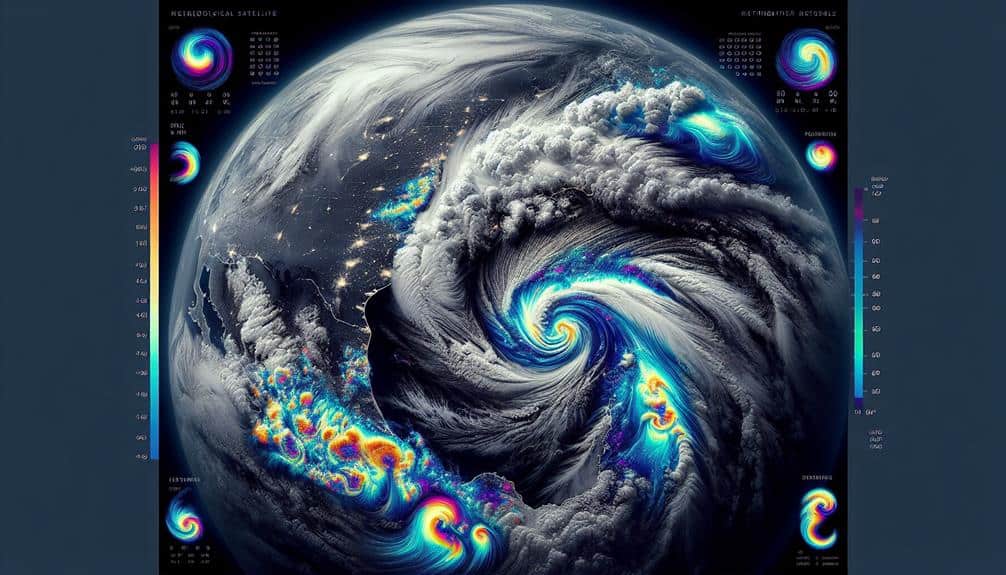
When analyzing satellite images for storm chasing, we use various types, including visible, infrared, and water vapor imagery, each providing distinct data sets necessary for accurate predictions.
Visible imagery offers high satellite resolution, allowing us to discern fine details such as cloud formations and surface features. This data is invaluable for precise image interpretation, enabling us to track storm development and movement with clarity.
Infrared imagery, on the other hand, measures thermal radiation, giving us insights into the temperature of cloud tops and surface areas. This is essential for weather prediction as it helps identify the intensity of storms. Cooler cloud tops often indicate stronger updrafts and severe storm potential. Utilizing this information, we enhance our storm tracking capabilities, ensuring we can anticipate a storm's path and intensity.
Water vapor imagery highlights moisture in the mid to upper levels of the atmosphere. By analyzing these images, we can pinpoint areas of high moisture content, which are typically conducive to storm formation. This data set complements our other imagery types, providing a detailed view of atmospheric conditions.
Incorporating these diverse satellite image types allows us to make informed, timely decisions, maximizing our storm chasing success while embracing the freedom of the open sky.
Reading Cloud Patterns
We'll start by identifying storm signatures through cumulonimbus formations and their associated reflectivity values on radar.
Next, we'll examine cloud movement analysis, focusing on wind vectors and velocity data.
Identifying Storm Signatures
Recognizing storm signatures involves analyzing distinct cloud patterns, such as supercells and squall lines, which are indicative of severe weather phenomena. By honing our ability to identify these formations, we can better predict storm formation and understand the associated atmospheric conditions.
Supercells, known for their rotating updrafts, often signal the potential for tornadoes and large hail. Squall lines, on the other hand, signify fast-moving bands of severe thunderstorms that can produce damaging winds.
To effectively identify storm signatures, we focus on:
- Supercells: Characterized by a hook echo visible on radar imagery, indicating a spiraling updraft.
- Squall Lines: Linear arrangements of thunderstorms that stretch across vast distances, often accompanied by a narrow cold front.
- Mesoscale Convective Systems (MCS): Large complexes of thunderstorms that can last for hours, contributing to widespread severe weather.
Cloud Movement Analysis
Building on our ability to identify storm signatures, analyzing cloud movement allows us to track the evolution of these weather systems and predict their trajectories with enhanced precision. By observing satellite imagery, we can monitor cloud morphology and velocity over time. This process involves precise wind direction analysis, which enables us to determine the flow patterns propelling storm systems.
We utilize advanced storm tracking techniques to scrutinize the movement of cumulonimbus clouds, often indicative of severe weather. Tracking these clouds' development and dissipation offers insights into the storm's lifecycle. For instance, rapid cloud top expansion can signal intensifying conditions, while a sudden collapse might indicate weakening.
Quantitative data from satellite images provide us with velocity vectors, which illustrate how fast and in what direction clouds are moving. By correlating this data with surface observations, we gain a detailed view of the atmospheric dynamics at play. This thorough analysis empowers us to create more precise storm trajectory models, enhancing our predictive capabilities significantly.
In essence, cloud movement analysis is a cornerstone of effective storm chasing. It allows us to anticipate changes, refine our strategies, and maintain the freedom to navigate safely and efficiently.
Precipitation Patterns Detection
Identifying specific precipitation patterns through detailed cloud pattern analysis allows us to forecast rainfall intensity and distribution with remarkable accuracy. By examining satellite imagery, we can decipher the structural nuances of cloud formations that signal impending precipitation. This capability is invaluable for weather forecasting and mitigating flood risk.
We focus on:
- Cloud Top Temperature: Colder cloud tops, visible in infrared satellite images, often indicate more intense rainfall.
- Cloud Density and Thickness: Denser, thicker clouds generally correlate with higher precipitation rates, aiding in precise rainfall estimations.
- Cloud Motion Vectors: Tracking the movement of cloud masses helps predict where and when precipitation will occur, enhancing our forecasting models.
Our data-driven approach guarantees we don't just rely on visual cues but integrate quantitative analysis to refine our predictions. Satellite imagery gives us the autonomy to make real-time decisions, essential for timely alerts and effective storm chasing.
Identifying Storm Systems
To pinpoint storm systems accurately, we analyze cloud formations, temperature gradients, and atmospheric moisture levels using satellite imagery. By examining these factors, we enhance storm tracking and weather prediction, offering us the freedom to anticipate and respond to severe weather events effectively.
We start by closely monitoring cloud formations. Cumulonimbus clouds, for instance, signify potential storm formation. We use infrared satellite data to capture temperature gradients, as temperature differentials between cloud tops and the surrounding atmosphere often indicate storm intensity. Higher cloud tops typically correlate with stronger storm systems, given their association with updrafts and convective activity.
Next, analyzing atmospheric moisture levels is significant. Water vapor imagery helps us identify areas with high moisture content, which is a key ingredient for storm formation. By overlaying these moisture maps with surface temperature data, we can predict where storms are likely to develop.
We also consider atmospheric conditions like wind shear and pressure systems. Wind shear, the variation of wind speed and direction with altitude, can either inhibit or enhance storm formation. Low-pressure systems, identified via satellite imagery, often serve as focal points for storm development.
Assessing Wind Speeds
We assess wind speeds by analyzing Doppler radar data, satellite-derived wind vectors, and interpreting scatterometer readings to quantify wind velocity and direction accurately. By using these tools, we can perform precise wind direction analysis, which is important for effective storm tracking and ultimately, successful storm interception.
To maintain accuracy, we focus on:
- Doppler Radar Data: This provides real-time wind speed estimation, allowing us to monitor the dynamic changes in storm systems.
- Satellite-Derived Wind Vectors: High-resolution satellite imagery gives us detailed wind direction analysis over large geographic areas.
- Scatterometer Readings: These instruments on satellites measure the backscatter from the ocean surface, helping us estimate wind speeds over water bodies.
Monitoring Precipitation
Leveraging advanced satellite sensors, we monitor precipitation patterns with high accuracy by analyzing radar reflectivity, cloud microphysics, and infrared imagery.
Radar reflectivity provides us with detailed data on precipitation intensity and type, allowing for precise precipitation tracking. By examining cloud microphysics, we can determine particle sizes and phases, which are pivotal for understanding storm dynamics and potential hail formation.
Infrared imagery complements our analysis by offering temperature profiles of cloud tops, aiding in the assessment of storm intensity. These data points enable us to differentiate between convective and stratiform precipitation, a vital distinction when predicting severe weather events.
We continuously update our models with real-time satellite data, ensuring that we can detect changes in storm intensity promptly. This approach not only helps us forecast potential flash floods but also informs our storm chasing strategies by identifying areas of significant precipitation.
Evaluating Temperature Data
Analyzing satellite-derived temperature data allows us to pinpoint thermal gradients and identify areas of atmospheric instability that are critical for storm development. By meticulously examining temperature trends, we can forecast where storm systems are likely to form and intensify. Thermal anomalies in particular are indicative of conditions ripe for severe weather events.
Leveraging this data involves:
- Detecting abrupt temperature changes that signal atmospheric fronts.
- Mapping temperature distributions to identify potential convective zones.
- Analyzing diurnal temperature variation to understand surface heating dynamics.
Our ability to interpret these temperature trends and anomalies gives us the freedom to make informed, real-time decisions. For instance, we can determine if a sudden drop in temperature juxtaposed with warm air masses suggests a robust storm front. These insights are indispensable for storm chasers who seek both the thrill of the chase and the safety that comes from precise forecasting.
Frequently Asked Questions
How Can Satellite Imagery Help With Predicting Tornado Formation?
Satellite technology aids tornado prediction by providing real-time data on atmospheric conditions. We can analyze temperature, humidity, and wind patterns, enhancing our ability to identify potential tornado formations and make timely, informed decisions for safety.
What Tools Are Necessary for Accessing Real-Time Satellite Data for Storm Chasing?
Sailing through the stormy seas, we need precise satellite tracking tools like GOES and Himawari. They provide real-time data essential for emergency response, ensuring we stay ahead of nature's fury and maintain our freedom to chase safely.
How Do Satellite Images Assist in Determining the Safety of a Storm Chase Route?
Satellite images help us with storm tracking and safety assessment by showing cloud formations. We can use this data for precise route planning, ensuring we avoid the most dangerous areas and chase storms safely.
Can Satellite Imagery Be Used to Differentiate Between Severe Storms and Regular Weather Patterns?
Satellite imagery is our crystal ball in weather forecasting. With advanced satellite technology, we can distinguish severe storms from regular weather patterns through precise meteorological analysis and storm detection, enhancing our understanding and decision-making freedom.
What Are the Limitations of Using Satellite Imagery in Storm Chasing Activities?
The limitations of using satellite imagery in storm chasing include data accuracy issues and time lag. We can't always rely on real-time updates, which may hinder precise tracking and decision-making during critical storm events.