You’ll maximize meteorological data analysis by integrating HRRR model forecasts with real-time atmospheric soundings and dual-polarization radar returns. Focus on environments exceeding 1000 J/kg CAPE combined with 0-1 km shear above 40 knots, then verify predictions using GOES-16 satellite imagery and windsond radiosondes deployed via helium systems. Cross-reference WSR-88D reflectivity data with in-situ probe measurements to track thermodynamic profiles, positioning yourself within critical sampling zones 30-45 minutes before tornadogenesis. The sections below break down each component’s operational implementation and measurement protocols.
Key Takeaways
- Integrate HRRR model forecasts with GOES-16 satellite data to verify predictions and refine target storm selection in real-time.
- Deploy helium probe systems with certified ultrasonic sensors to capture in-situ wind, temperature, and humidity measurements within supercells.
- Analyze Skew-T diagrams focusing on CAPE geometry, CIN values, and hodograph-derived shear parameters to assess tornadic potential.
- Combine mobile Doppler radar reflectivity data with probe telemetry to validate rotation signatures and thermodynamic profiles simultaneously.
- Apply ingredient-based methodology targeting environments with 1000+ J/kg CAPE and 0-1 km shear exceeding 40 knots for tornadoes.
Essential Forecasting Tools and Models for Target Selection
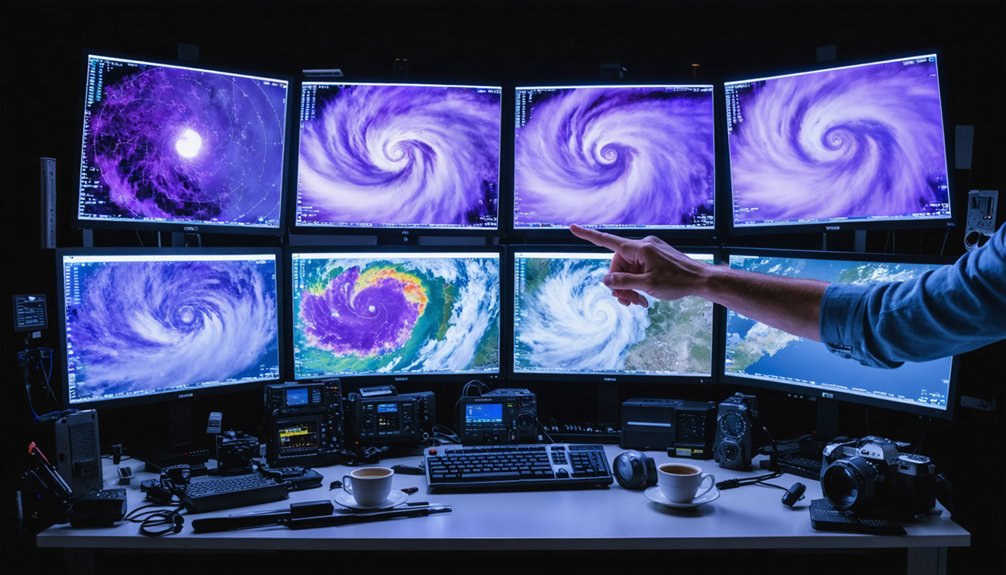
Before you can intercept a supercell, you’ll need to synthesize data from multiple forecasting platforms to identify ideal target zones. Start with HRRR model runs for mesoscale storm development predictions, accessing outputs through COD and Twisterdata.
Model accuracy assessment becomes critical when comparing ensemble forecasts across global to mesoscale ranges—verify initialization parameters against current observations. Analyze model soundings and Skew-T log-P diagrams to quantify instability and wind shear profiles.
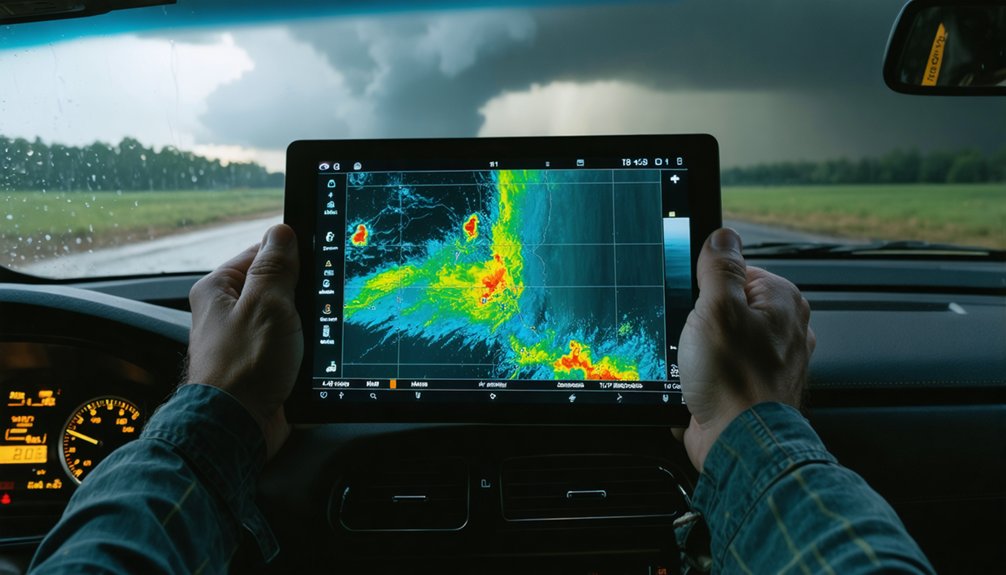
Satellite data integration through GOES-16 provides real-time verification of model predictions, enabling precise target adjustments. SPC mesoscale analysis maps deliver operational forecaster insights on wind shear parameters and convective potential.
Cross-reference SPC forecast discussions with WPC and Nadocast outputs to eliminate uncertainty. This multi-platform approach maximizes your autonomy in selecting high-probability intercept locations.
Deploying Helium Probes in Supercell Wind Fields
Once you’ve identified your target intercept zone through multi-model analysis, you’ll need direct measurements from inside the supercell to validate atmospheric conditions that no remote sensing platform can provide. Windsond radiosondes mounted on 13-gram dual-balloon systems deliver multi parameter wind profiles as updrafts transport them through storm cores.
FT752 ultrasonic sensors certified to 90 meters per second—with balloon probe survivability testing validated to 108 meters per second—ensure data integrity in extreme turbulence. AI-powered UAVs position themselves at storm edges, launching probes when onboard algorithms detect ideal deployment windows.
Real-time telemetry transmits temperature, humidity, and wind velocity directly to your ground station while you’re maintaining safe distances. This autonomous approach eliminates bureaucratic delays inherent in human-controlled systems, maximizing your operational flexibility during rapidly evolving mesocyclone events.
Interpreting Skew-T Diagrams and CAPE Values in the Field
When you retrieve mobile Skew-T soundings from radiosonde launches near your target storm, prioritize identifying the CAPE profile geometry—fat, low-topped instability (1000-2000 J/kg concentrated below 500 mb) signals tornadic potential, while tall, skinny profiles indicate marginal tornado risk despite high absolute values.
Overlay your observed wind barbs against the hodograph to calculate 0-1km SRH and 0-6km bulk shear, ensuring you’ve met the critical thresholds of >100 m²/s² and >50 knots respectively for supercell maintenance.
Balance your instability assessment with CIN magnitude; values exceeding 100 J/kg require aggressive frontal forcing or significant boundary-layer heating to liberate the available CAPE for explosive updraft development.
Reading CAPE Energy Profiles
Convective Available Potential Energy (CAPE) quantifies the atmospheric fuel available to power thunderstorm updrafts, expressed in joules per kilogram (J/kg) and ranging from zero to values exceeding 5,000 J/kg. You’ll calculate CAPE by measuring the area between the environmental temperature trace and your rising parcel trajectory on skew-T diagrams.
Values below 1,000 J/kg indicate marginal instability, while readings between 2,500-4,000 J/kg signal severe storm potential. Beyond 4,000 J/kg, you’re observing explosive conditions.
When determining instability thresholds, distinguish between MUCAPE and SBCAPE measurements—they’re not directly comparable. Remember that high CAPE alone won’t trigger convection. You must evaluate CAPE distribution depth and assess directional wind shear simultaneously. The vertical extent of positive buoyancy determines whether updrafts sustain organized supercells or dissipate prematurely.
Shear-Instability Balance Assessment
CAPE measurements tell only half the story—you’ll find storms organize into distinct morphologies based on how vertical wind shear modifies buoyant updrafts. The balance between instability and shear determines whether you’re tracking isolated supercells or multicellular clusters.
When shear exceeds 40 knots through the 0-6 km layer, it tilts updrafts, separating precipitation from the inflow region and extending storm longevity. Directional shear matters critically—veering winds exceeding 45° in the planetary boundary layer generate storm-relative helicity, quantifying the vertical motion forces driving storm updraft rotation.
Calculate BRN shear using 0.5 × (U_avg)² where values between 25-100 indicate supercell potential. Your hodograph’s curvature reveals rotational capacity; curved profiles with substantial length signal enhanced tornado probability when combined with adequate low-level moisture convergence.
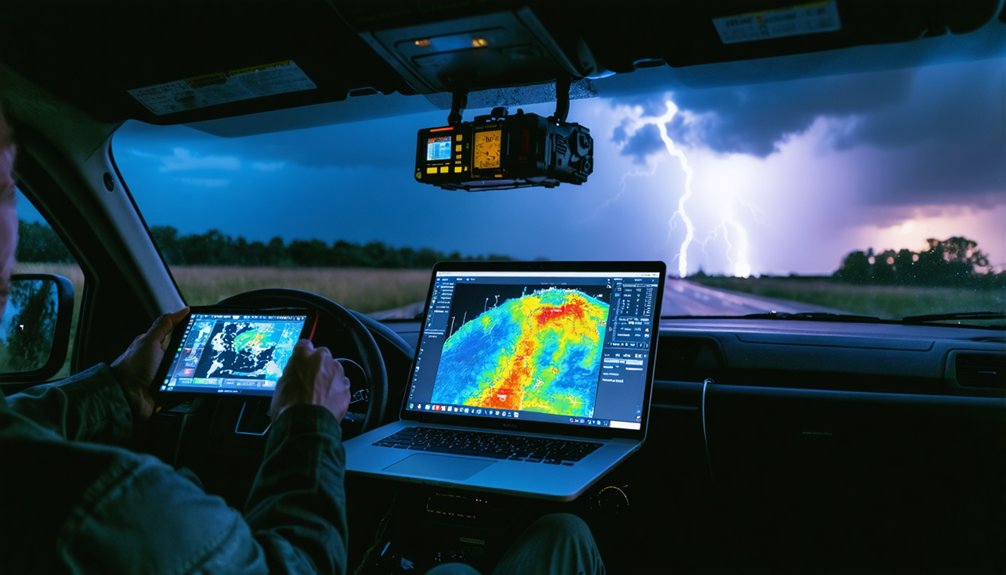
Combining Radar Data With Real-Time Probe Measurements
Modern storm analysis synthesizes two complementary data streams: radar’s broad atmospheric view and probes’ precise in-situ measurements. You’ll track up to 34 probes simultaneously while cross-referencing WSR-88D reflectivity data updating every 89-270 seconds. Interpreting thermodynamic profiles from probe temperature and pressure readings alongside dual-polarization radar reveals the physical mechanisms driving wind field evolution in supercells.
Your mobile Doppler positioning within 4 km of developing mesocyclones captures rotation signatures while probes transmit real-time humidity gradients. Monitoring probe data quality remains critical—successful 90-minute deployment windows demand immediate verification of GPS coordinates and atmospheric readings.
Phased array radar’s sub-60-second scans combined with probe networks enable you to identify tornado precursors minutes before formation, transforming raw measurements into actionable forecasting intelligence that enhances warning lead times.
Ingredient-Based Forecasting for Tornadic Supercells

Ingredient-based forecasting for tornadic supercells requires you to quantitatively assess Convective Available Potential Energy (CAPE) alongside vertical wind shear parameters, as both ingredients must reach critical thresholds simultaneously for supercell development.
You’ll need to evaluate CAPE values from representative parcels while calculating shear magnitude across multiple layers (0–1 km, 0–3 km, 0–6 km) to determine supercell potential and tornado likelihood. Identifying specific lift mechanisms—frontal boundaries, drylines, outflow boundaries, or orographic features—enables you to pinpoint where and when these ingredients will combine to initiate convection.
Evaluating CAPE and Shear
While traditional forecasting methods relied heavily on pattern recognition and subjective experience, the ingredient-based approach provides storm chasers with quantifiable atmospheric parameters that directly correlate with supercell and tornado development.
When evaluating effective CAPE, you’ll find superior discrimination between tornadic and non-tornadic supercells compared to surface-based values. Target environments exceeding 1000 J/kg for significant tornado potential. However, CAPE alone won’t predict tornadoes—you must integrate wind shear analysis.
Focus on 0-1 km shear exceeding 40 knots and 0-6 km shear above 50 knots when examining convective mode. High shear/low CAPE environments still produce tornadoes, demonstrating shear’s primacy. Calculate effective SRH from the effective surface level, targeting values exceeding 250 m²/s² in the 0-3 km layer for maximum tornado probability on chase days.
Identifying Lift Mechanisms
In tropical cyclone environments where natural buoyancy remains relatively lower, forced lift becomes critical for supercell genesis. Your forecast accuracy demands identification of both synoptic and mesoscale contributions simultaneously.
Mesoscale modifications can enable supercell development in otherwise marginal setups, allowing you to capitalize on evolving opportunities that conventional threshold-based approaches would miss entirely.
Collaborative Research Efforts Advancing Storm Prediction
Collaborative frameworks have fundamentally transformed storm prediction accuracy through multi-institutional data integration and real-time operational testing. You’ll find mesoscale predictability improvements through ensemble forecasting that reveals storm likelihood by analyzing forecast agreement across multiple models. The WoFS testbed connects nine NWS offices, demonstrating how real-time collaboration enhances warning-scale guidance. Penn State’s algorithm leverages satellite archives since 2000, extracting cloud motion patterns that numerical models miss.
These efforts deliver critical advantages:
- Ensemble datasets quantify uncertainty in moisture profiles and wind shear—you’re no longer flying blind
- Real-time virtual collaboration eliminates bureaucratic delays between research and operations
- Historical climate analysis determines if seasonal severe weather patterns become more or less predictable as conditions shift
You’ll access technology transfers that expedite research integration into operational forecasting without institutional gatekeeping.
Translating Field Data Into Actionable Nowcasting Alerts
Field-deployed instrumentation transforms raw atmospheric measurements into time-critical warnings through systematic data fusion protocols. You’ll leverage multi-angle radar networks scanning entire storm structures while shorter-wavelength systems capture high-resolution tornado signatures. DOW units have documented wind speeds exceeding 318 mph, providing quantifiable thresholds for alert generation. Validating radar insights through crowdsourcing enables videographic confirmation of tornadogenesis events, reducing false-positive rates.
Your ground sensors monitor pressure drops, wind shifts, temperature gradients, and humidity changes—streaming real-time data via LoRaWAN networks where cellular infrastructure fails. Integrating field data with numerical models refines prediction accuracy by testing theoretical tornado development mechanisms against observed conditions. Tools like RadarScope, GRLevel3, and SPC Mesoscale Analysis deliver immediate visualization, converting raw measurements into actionable intelligence that enables autonomous decision-making during evolving storm events.
Frequently Asked Questions
What Are the Typical Costs of Helium Probes and Weather Balloons for Independent Chasers?
You’ll spend $200 per complete weather balloon kit including radiosonde. Helium procurement strategies and balloon transportation costs add variables, but annual twice-daily launches total $146,000. Single deployments remain cost-effective for independent operations versus commercial alternatives.
How Do You Safely Recover Probes After They Land in Remote Areas?
You’ll execute probe recovery procedures by tracking GPS coordinates to remote terrain navigation points, then deploying grappling hooks, ropes, and specialized tools. Pack water, food, and recovery gear while monitoring real-time position data for autonomous retrieval operations.
Which Mobile Internet Providers Offer the Best Coverage Across the Great Plains?
T-Mobile’s tremendous coverage dominates with 67% Nebraska reach and superior cell tower density across plains. You’ll get reliable data coverage quality at $30/month. Starlink delivers 99% availability everywhere, ensuring you’re never restricted by terrain or infrastructure limitations.
What Permits or Permissions Are Needed to Launch Weather Balloons Legally?
You’ll need FAA notification (not formal permits) for payloads under 12 lbs, plus written property owner permission for launch site selection. Government regulations require advance notice to air traffic control and compliance with airspace restrictions—no licensing necessary.
How Do You Protect Electronic Equipment From Hail During Close Storm Intercepts?
You’ll shield electronics using portable storm shelters with reinforced compartments and vehicle hail protection systems like roof-mounted barriers. HailSens sensors withstand -40°F to +158°F while operating continuously, ensuring your equipment survives direct hailstone impacts during close-range intercepts.