You’ll optimize storm data analysis by integrating NEXRAD radar reflectivity updates (4-6 minute intervals, faster during severe weather), mobile surface observations, and GPS positioning into real-time decision matrices. Interpret color-coded precipitation scales while accounting for beam anomalies and range attenuation. For hurricanes, combine National Hurricane Center’s 6-hour advisories with 15-minute data streams, recognizing the forecast cone’s 67% confidence interval means one-in-three chances the center tracks outside predicted boundaries. Advanced nowcasting algorithms and automated analysis tools transform raw meteorological data into actionable intercept strategies that account for both probabilistic forecasts and ground-truth observations.
Key Takeaways
- Utilize NEXRAD radar with 2-6 minute update intervals and SAILS technology for tracking rapidly evolving storm-scale features.
- Monitor integrated data platforms combining radar streams, GPS positioning, and direct environmental measurements for comprehensive situational awareness.
- Interpret radar reflectivity patterns while accounting for beam anomalies, range attenuation, and non-meteorological echoes affecting data accuracy.
- For hurricanes, combine 6-hour NHC advisories with 15-minute data streams to bridge temporal gaps in official forecasts.
- Position strategically using forecast cone margins, recognizing 67% confidence intervals and hazards extending beyond cone boundaries.
Essential Data Sources for Storm Chasing Operations
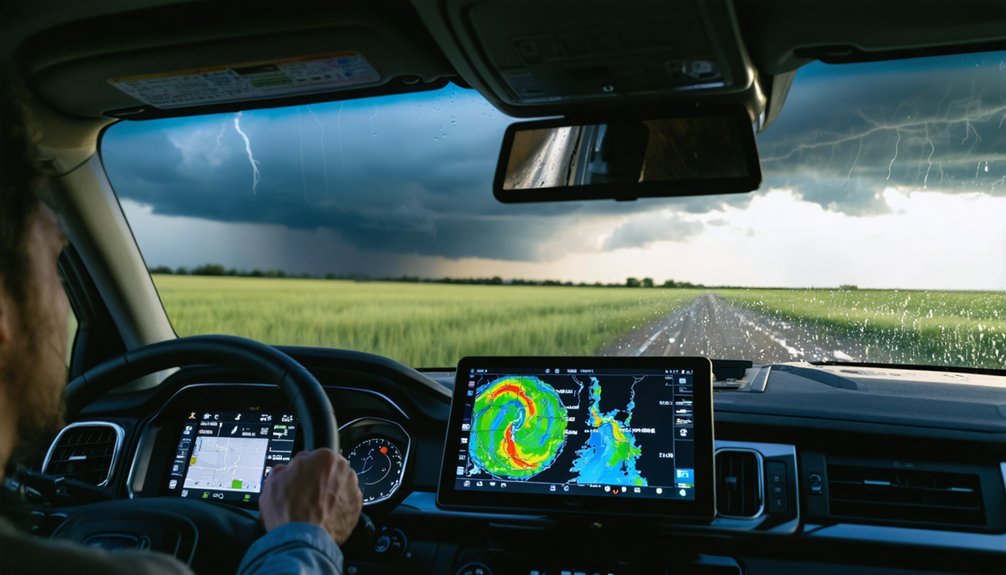
Modern storm chasing operations integrate four critical data categories: mobile communications infrastructure, real-time radar streams, direct environmental measurements, and geographic positioning systems. You’ll need integrated data platforms that combine XM Weather’s 5-minute nowcasting updates with super-resolution Level II radar streams through applications like RadarScope and GRLevel3.
Sensor network coordination becomes essential when synchronizing instrumented vehicle transects with weather balloon ascents and UAS deployments. Your communication redundancies—whether 4G LTE or satellite-based DataStorm—ensure uninterrupted data flow when networks fail.
Direct measurements from Electric Field Meters predict lightning development, while rain-cooled air temperature profiles from balloons reveal storm structure. GPS mapping overlays position your intercept teams across topographic networks, enabling rapid route recalculation as conditions evolve. This multi-layered approach maximizes situational awareness during high-stakes field operations.
Understanding NEXRAD Radar Reflectivity and Color-Coded Precipitation
NEXRAD transmits electromagnetic pulses that reflect off precipitation particles, with larger droplets and higher concentrations producing stronger return signals measured in decibels of Z (dBZ).
You’ll interpret the color-coded scale where greens represent light precipitation (20-40 dBZ), yellows and oranges indicate moderate to heavy rain (40-55 dBZ), and reds through purples signal intense precipitation or hail (55+ dBZ).
Radar data refreshes every 4-6 minutes during volume scans, though you’ll experience additional latency from processing and transmission delays that affect your real-time positioning decisions.
NEXRAD Wave Reflection Mechanics
When electromagnetic energy strikes precipitation targets, the NEXRAD radar system captures the backscattered returns through a precisely engineered 1-degree pencil beam that pulses up to 1300 times per second. You’ll notice returned energy diminishes at 1/R², meaning targets at 100 miles yield one-quarter the signal strength of those at 50 miles. This range attenuation directly affects your reflectivity interpretation.
Watch for beam anomalies during your chase operations—atmospheric superrefraction creates anomalous propagation, particularly near the surface. These refraction impacts bend the beam’s path, generating false ground clutter at low reflectivities around 10 dBZ. Your dual-polarization data helps distinguish legitimate precipitation from these non-meteorological echoes. Understanding these mechanics lets you filter atmospheric noise and identify genuine storm structure in real-time field conditions.
Interpreting Precipitation Color Scales
Every color displayed on your radar screen represents a specific range of reflectivity values measured in decibels of Z (dBZ)—a logarithmic scale that quantifies the intensity of energy returned from precipitation targets. Green and blue indicate light rain below 1/10 inch per hour, while yellow signals moderate rates around 3/10 inch. Orange marks heavy precipitation exceeding 1 inch per hour, and red indicates torrential downpours over 2 inches. Pink and purple reveal extreme intensity, often correlating with severe thunderstorms or hail cores.
Understanding storm cell dynamics requires recognizing that distant echoes sample elevated precipitation, not ground-level threats. Beam overshoot increases with range, potentially misrepresenting surface conditions. Effective communication practices among chase teams depend on accurately interpreting these color gradients, paired with visual ground truth to avoid positioning errors during rapidly evolving weather scenarios.
Real-Time Radar Update Intervals
Recognizing color gradients on your display matters little if you’re analyzing outdated information during rapidly intensifying storms. NEXRAD’s standard volume coverage patterns complete full scans in 4-6 minutes under normal conditions, with VCP 12 requiring approximately 4.5 minutes across 14 elevation angles.
During severe weather, faster radar scan rotation patterns drop intervals to 2-3 minutes. SAILS technology repeats the lowest elevation up to three times per volume, while MRLE rescans the lowest four elevations mid-volume, dramatically improving radar sampling frequencies for storm-scale features. You’ll receive base reflectivity updates tied directly to each scan cycle completion. This temporal resolution proves critical when tracking tornadogenesis or rapidly developing mesocyclones.
Phased Array Radar completes full scans in under one minute, representing the future of storm-chasing technology.
Leveraging Hurricane Tracking Systems and Forecast Updates
You’ll gain critical situational awareness by accessing NOAA’s National Hurricane Center advisories, which deliver standardized updates every six hours at 5 am, 11 am, 5 pm, and 11 pm EDT. The forecast cone represents the probable track of a storm’s center with approximately 67% confidence, meaning there’s a one-in-three chance the actual path falls outside those margins.
To maintain operational precision, integrate 15-minute data streams from GOES satellites and real-time buoy networks alongside the six-hour advisory cycle, creating a layered analysis framework that captures both official forecasts and high-frequency environmental changes.
Real-Time NOAA Data Access
When tracking active tropical systems, NOAA’s National Environmental Satellite, Data, and Information Service (NESDIS) delivers immediate access to hurricane positions through its live tracker map, which integrates National Hurricane Center data with current satellite imagery. You’ll find the interactive interface at noaa.maps.arcgis.com displays both historical and real-time storm paths for effective hurricane data visualization.
For operational forecasting, you can tap into NOAA’s Hurricane Analysis and Forecast System (HAFS) through AWS S3 bucket noaa-nws-hafs-pds. Access seven-day forecasts covering track, intensity, rapid intensification, storm surge, and rainfall without creating an account using: aws s3 ls –no-sign-request s3://noaa-nws-hafs-pds/. This data assimilation framework supports extreme weather event modeling with ocean coupling parameters that enhance your field deployment decisions and real-time trajectory analysis.
Interpreting Forecast Cone Margins
Access to real-time hurricane data provides the foundation, but operational effectiveness depends on accurate interpretation of the forecast cone’s probabilistic boundaries. You’re working with a 67% confidence interval—the center moves outside cone boundaries in one of every three forecasts.
Analyzing cone uncertainty dynamics requires understanding that 200-nautical-mile radius at 120 hours represents historical error margins, not storm size. You’ll find hazards extending well beyond these margins, particularly as forecast accuracy improves and cones narrow.
Integrating cone probabilities with on-the-ground observations means cross-referencing wind probability graphics, surge predictions, and rainfall forecasts rather than relying on track alone. Your chase positioning strategy must account for the 33% probability the center won’t follow the depicted path, maintaining tactical flexibility throughout your deployment.
15-Minute Update Integration Strategies
Every second counts when hurricane conditions deteriorate rapidly, making minute-level data integration the operational differentiator between proactive positioning and reactive scrambling. HURRTRAK EM/Pro interfaces directly with online services, eliminating manual data entry while delivering continuous forecast updates. You’ll gain real-time storm positioning without workflow interruptions, reducing data latency that compromises chase decisions.
Cloud integration capabilities enable automated transmission of hurricane track modifications, intensity changes, and forecast cone adjustments straight to your dashboard. This architecture removes the delay inherent in manual refresh cycles, giving you unfiltered access to evolving storm intelligence.
Baron Weather’s 4-minute radar refresh cycles complement hurricane tracking intervals, creating synchronized data streams that reveal both mesoscale storm structure and broader circulation patterns—critical insights when positioning teams across multiple impact zones.
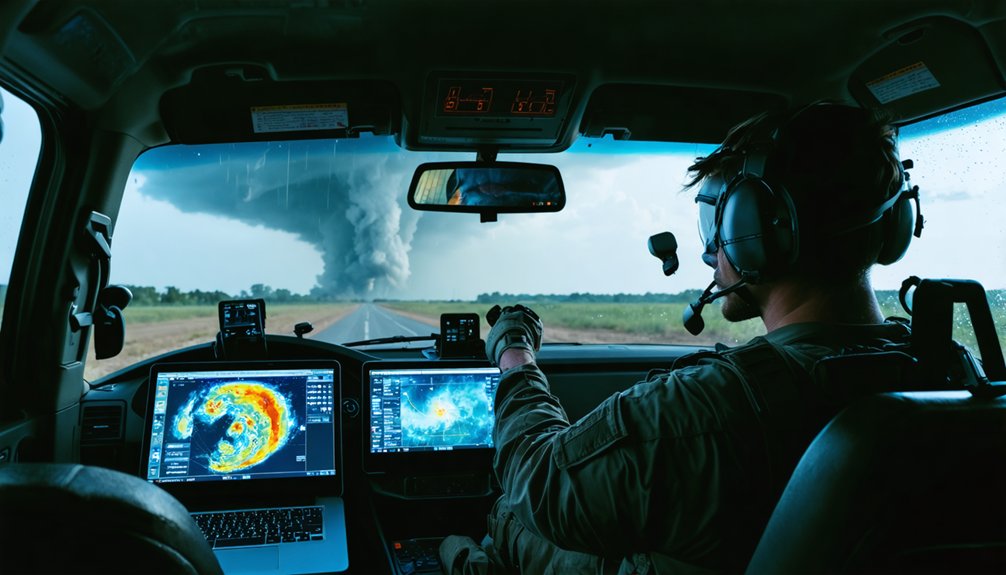
Advanced Analysis Technologies for Real-Time Storm Monitoring
Several breakthrough technologies have fundamentally transformed how meteorologists capture and analyze storm data in real-time. You’ll now access Doppler on Wheels units that collect high-resolution precipitation dynamics while traversing storm systems independently. S-band Dual Polarization Doppler Radar penetrates where fixed installations can’t reach due to terrain obstacles.
Satellite based climate monitoring through passive microwave radiometers observes temperature, humidity, and precipitation across 1700km swaths—functioning through cloud cover that blocks visible-spectrum systems. You’re getting constellation coverage that matches operational capabilities at fraction costs.
Machine learning algorithms fuse NOAA GOES, EUMETSAT Meteosat, and proprietary observations into NetCDF formats for your existing workflows. Real time hail detection emerges from dual-polarization QPE algorithms scanning 14 elevation angles every 4.5 minutes, delivering storm total precipitation estimates on continuously updated grids.
Automated Nowcasting Tools for Thunderstorm Prediction
Real-time data collection proves most valuable when paired with automated prediction systems that convert observations into actionable forecasts within operational timeframes. You’ll find tools like TITAN tracking storms through radar reflectivity regions, while AutoNowcaster executes pattern recognition algorithms across multiple data streams for 60-minute projections.
COMMAS ingests radar and lightning data into 3D cloud models, simulating storm evolution with precision you can’t achieve manually. The FLASH system delivers 1-km resolution flash flood forecasts every five minutes from MRMS rainfall data. Deep learning models extend nowcasts to four hours, capturing storm growth and decay cycles.
Ensemble forecast fusion combines weighted algorithm outputs through fuzzy-logic engines, strengthening accuracy beyond single-model limitations. These systems process complex datasets in minutes, giving you decision-making freedom during rapidly evolving conditions.
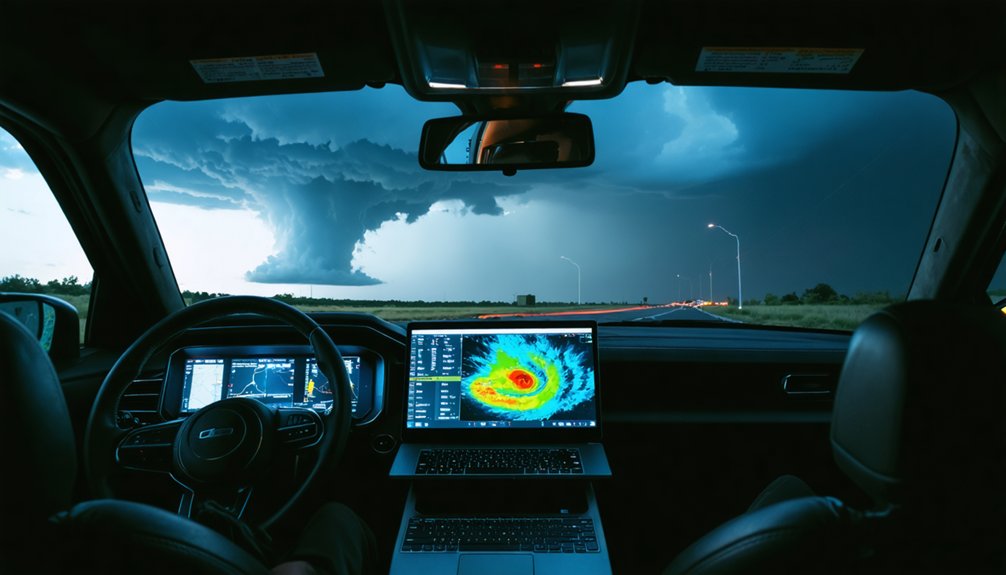
Mobile Integration: IoT Devices and Weather Apps in the Field
Mobile weather applications transform your vehicle into a rolling command center, delivering sub-kilometer radar resolution and algorithmic threat detection that rivals National Weather Service workstations. RadarScope’s Level II NEXRAD data provides 99% reliability at forecaster-grade speeds, while Storm Hunter WX’s Future Scan extrapolates cell movement 60 minutes ahead.
Level II NEXRAD delivers forecaster-grade radar resolution to your dashboard, transforming amateur vehicles into meteorological command centers with 99% data reliability.
You’ll need robust cellular connectivity analysis—deploy Weboost Drive Reach amplifiers alongside multiple carrier hotspots for uninterrupted data streams. DataStorm satellite systems cover cellular dead zones during remote pursuits.
Storm Chasers app integrates SpotterNetwork API for real-time geolocation redundancy, displaying fellow chasers’ positions within 24-hour windows. XM Weather updates every five minutes via mobile antenna, ensuring continuous situational awareness.
Personal weather stations from Weather Underground network feed hyperlocal measurements directly into your decision matrix, eliminating dependence on sparse mesonet coverage.
Overcoming Data Quality and Integration Challenges
When you integrate multiple data streams during active storm intercepts, inconsistencies between NEXRAD, satellite feeds, and mobile observations create critical decision-making vulnerabilities. You’ll face satellite data limitations in temporal resolution and atmospheric interference that compromise real-time accuracy. Establishing data quality frameworks becomes essential for field operations.
Critical integration solutions:
- Implement automated validation protocols that cross-reference multiple sources before making intercept decisions
- Deploy robust monitoring systems detecting data gaps or transmission failures during active chases
- Establish version-controlled preprocessing pipelines eliminating manual inconsistencies across platforms
- Coordinate with upstream providers to resolve unreliable source data at origin points
- Upgrade infrastructure supporting scalable architecture as data volumes increase from enhanced satellite coverage
You can’t afford compromised data integrity when positioning ahead of rotating supercells. Systematic quality controls protect against catastrophic navigation errors.
Translating Ensemble Models Into Actionable Storm Intercept Decisions
Ensemble forecast models generate probabilistic outputs that demand interpretation frameworks before you can execute high-stakes positioning decisions in the field. You’ll find WoFS mesocyclone probabilities above 60% over-predict near-term threats, while reliability strengthens at 90-150 minute lead times—critical intelligence for route planning.
Machine learning calibration transforms raw ensemble data into actionable guidance by weighing intra-storm predictors more heavily than environmental parameters. This probabilistic intensity guidance reveals when models converge on rapid intensification scenarios or hint at earlier track deviations.
You gain decision superiority through ensemble model uncertainty quantification, converting probability spreads into positioning confidence levels. Simple averaging consistently outperforms individual models, though quantile-based bias correction proves essential for tropical systems. Your intercept success hinges on translating member agreement into commitment thresholds.
Frequently Asked Questions
What Are the Legal Requirements for Storm Chasing in Different States?
You’ll find most states lack storm chasing regulations—coincidentally granting you freedom. Oklahoma’s pioneering licensure for professionals, while state liability policies vary widely. You’re generally unrestricted unless seeking emergency vehicle privileges or accessing closed roads during severe weather.
How Do Storm Chasers Coordinate With Emergency Services During Active Pursuits?
You’ll coordinate through established communication protocols by routing reports through EOC or JCOM to NWS, while deploying mobile command centers strategically on high ground. You’re maintaining direct contact via assigned talk groups, ensuring real-time data reaches emergency managers efficiently.
What Backup Power Solutions Work Best for Mobile Radar Equipment?
You’ll need dual portable generators with automatic switchover systems for primary power, backed by solar battery banks for redundant coverage. This configuration delivers uninterrupted radar operation during extended pursuits, ensuring you’re never dependent on grid infrastructure when tracking storms.
How Can Chasers Verify Data Accuracy When Multiple Sources Conflict?
Cross-reference radar signatures with ground truth observations, prioritizing dual-polarization data and MRMS algorithms. You’ll validate real-time reports by comparing spotter networks against TVS detections, then trust higher-confidence sources showing consistent patterns across multiple platforms before committing resources.
What Insurance Coverage Protects Storm Chasers and Their Specialized Equipment?
You’ll need bulletproof liability insurance policies and thorough/extensive equipment replacement coverage—standard plans won’t touch storm chasing’s risks. Multi-peril protection shields your cameras, tracking systems, and vehicle-mounted gear from tornado, hail, lightning, and collision damage during pursuits.