You’ll navigate storm chasing locations using GPS-integrated platforms that overlay real-time radar with live chaser streams across Tornado Alley‘s 500,000+ square miles, from Texas through Nebraska. Interactive maps display rotating mesocyclones, hook echoes, and debris signatures while the 35-Zone System divides terrain into navigable sectors based on road density and chase efficiency. GOES satellite imagery, NWS Enhanced Radar velocity products, and spotter networks provide continuous updates as supercells evolve. Master these data layers and you’ll transform atmospheric chaos into strategic positioning.
Key Takeaways
- Core Tornado Alley includes Texas, Oklahoma, Kansas, Nebraska, and Iowa, with tornado activity now shifting eastward toward Mississippi Valley.
- The 35-Zone System divides 500,000+ square miles into navigable sectors based on road density, terrain accessibility, and historical chase efficiency.
- GPS-integrated streaming platforms provide real-time visual confirmation of tornadoes with radar overlays, chase feeds, and tornado warning notifications.
- GOES satellite viewers and NWS Enhanced Radar deliver mesocyclone identification algorithms, storm-relative velocity products, and convective initiation detection.
- Pre-chase zone planning requires ranking sectors by grid quality, analyzing terrain constraints, and integrating tools like GRLevel3 radar displays.
Understanding Tornado Alley and Chase Zone Divisions
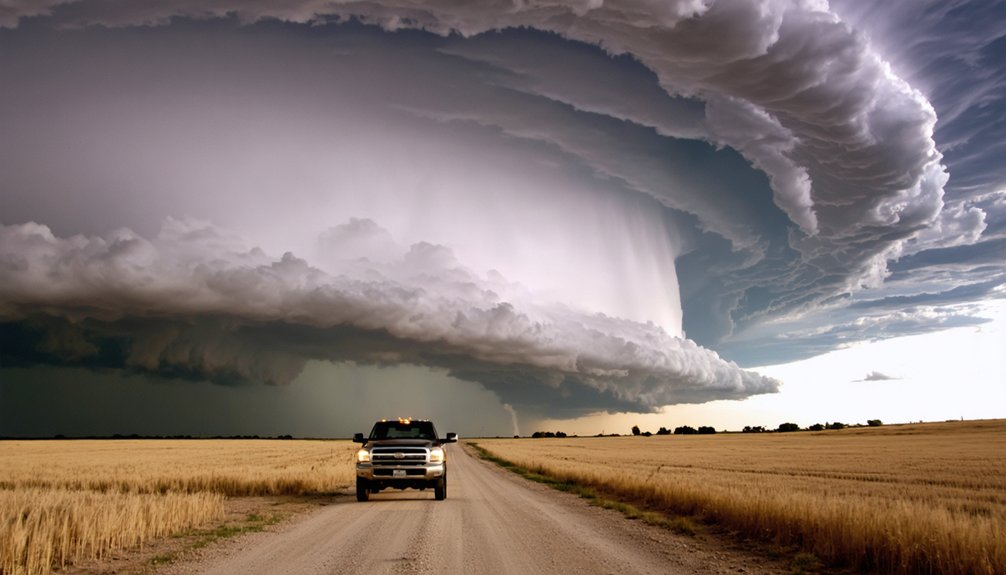
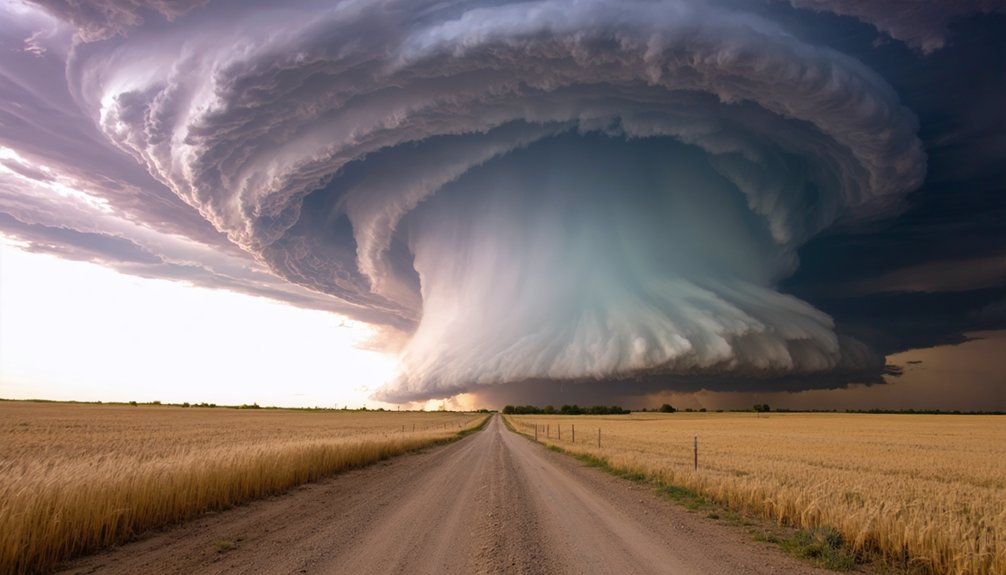
While the term “Tornado Alley” permeates meteorological discussions and storm chasing literature, no official boundaries delineate this central United States region. You’ll find core states—Texas, Oklahoma, Kansas, Nebraska, and Iowa—consistently identified since the 1952 research coinage, yet extended definitions incorporate up to 15 additional states from Montana to Ohio.
Historical tornado frequency trends reveal the media-designated zone where Gulf moisture collides with Canadian air masses across flat Plains terrain, generating ideal supercell environments. However, shifts in tornado hot spots now challenge traditional mapping. Data spanning 1950-2024 documents eastward migration toward the Mississippi Valley and Southeast, creating “Dixie Alley” with elevated activity in Alabama, Tennessee, and Mississippi.
Modern Doppler detection (post-1997) captures weaker tornadoes previously unrecorded, fundamentally altering your chase zone strategies.
Live Interactive Storm Chasing Platforms and Apps
Modern mobile platforms transform your chase operations through GPS-integrated streaming technologies that deliver real-time visual confirmation of rotating mesocyclones and tornado touchdowns. You’ll access dashboard feeds from veteran chasers intercepting supercells, with automatic stream updates eliminating manual refreshes. Interactive maps display active pursuits across multiple severe weather events—hail cores, wind damage swaths, and lightning clusters.
These platforms enable immediate weather data interpretation through live broadcasts synchronized with radar overlays and storm reports. You can rewind 24 hours of chase activity for post storm analysis, examining intercept strategies and mesocyclone evolution patterns. Mobile notifications alert you when chasers go live during tornado warnings, letting you witness verification of hook echoes and debris signatures. The technology removes geographic barriers, providing unrestricted access to multiple simultaneous chase operations nationwide.
Real-Time Satellite and Radar Imagery Tools
Pulling up real-time satellite and radar displays delivers critical atmospheric data that separates successful intercepts from missed opportunities. You’ll access multi-source weather data visualization through platforms combining NOAA GOES, EUMETSAT Meteosat, and JMA Himawari feeds with enhanced radar mosaics.
These systems integrate spotter report aggregation from NWS storm-based alerts and ArcGIS tornado maps tracking hail, wind, and funnel reports across 24-hour windows.
Essential imagery tools include:
- GOES Imagery Viewer providing continental, regional, and full-disk sectors with visible, infrared, and water vapor channels updated every 10 minutes
- College of DuPage satellite viewer delivering multi-spectral analysis for convective initiation detection
- NWS Enhanced Radar offering storm-relative velocity products and mesocyclone identification algorithms
- NASA LANCE FIRMS heat spots revealing fire-weather interactions and outflow boundary locations
Strategic storm positioning requires mastering the 35-Zone System, a geographic framework that divides Tornado Alley‘s 500,000+ square miles into navigable sectors defined by road network density, terrain accessibility, and historical chase efficiency. You’ll optimize intercepts through pre chase zone planning—ranking sectors by grid quality and analyzing terrain constraints before deployment.
Each zone utilizes state lines and rivers as boundaries, enabling rapid zone boundary coordination when cellular networks fail. Pair this system with Garmin Overlander 2025 Edition for offline GPS routing, or overlay zones on GRLevel3 radar displays for mesocyclone tracking. The framework integrates seamlessly with Google Maps Offline and traditional atlases, ensuring you’ll maintain positional awareness when pursuing supercells through remote sectors.
Experienced chasers developed these boundaries through iterative field testing across Plains, Midwest, and Dixie Alley domains.
Spotter Network Integration for Ground Coordination
You’ll achieve ideal ground coordination by integrating Spotter Network’s real-time position sharing protocols into your chase operations. The platform supports Windows, APRS, GpsGate.com, RadarScope, and mobile agents across WindowsMobile, Blackberry, and Android devices—enabling continuous GPS-based location updates to NWS coordinators and fellow spotters.
Multi-platform activity feeds display active members as green dots and inactive members as red dots, providing instant situational awareness of spotter deployment density relative to convective cell positioning.
Real-Time Position Sharing Tools
Real-time position sharing through SpotterNetwork integration transforms storm chasing from isolated pursuit into coordinated ground operations. You’ll access live GPS feeds from multiple chasers simultaneously, enabling tactical positioning decisions based on actual ground truth rather than radar interpretation alone. Apps like RadarScope and Radar Omega transmit your coordinates directly to the API, creating dynamic overlays viewable across platforms including StormWindow and StormCenter.
Essential position-sharing capabilities include:
- 24-hour position rewind for post-chase analysis and pattern recognition
- Multi-chaser tracking with storm report integration for situational awareness
- Remote monitoring allowing home-based coordinators to guide field operations
- Cross-platform compatibility ensuring data accessibility regardless of device ecosystem
Effective deployment requires adherence to reporting ethics and monitoring guidelines—particularly disabling broadcasts when off-duty. Cell signal redundancy through multiple carriers and boosters maintains transmission reliability during critical intercept windows.
Multi-Platform Spotter Activity Feeds
Position broadcasts gain exponential value when aggregated across networks of multiple spotters simultaneously reporting from dispersed geographic positions. Spotter Network’s multi platform application integrations deliver near real time position broadcasting across Windows agents, iPhone, iPad, Android, RadarScope, and Radar Alive! systems. Your location-aware devices transmit updates via cellular, Wi-Fi, GPS, and APRS protocols, creating consolidated situational awareness for National Weather Service forecasters and emergency coordinators.
Custom data feeds enable selective monitoring—Twin Cities WFO tracks 215 dedicated spotters through private channels, while alternative feeds integrate into third-party platforms. Activity indicators display green dots for active members, red for inactive status. Ground truth from 25+ spotters converging on single storm cells provides verification beyond radar’s inherent limitations, eliminating relay-chain distortion while maintaining autonomous operation protocols.
Essential Safety Protocols for Storm Chasers
While storm chasing offers unparalleled opportunities to document severe weather phenomena, it inherently exposes you to life-threatening conditions that demand rigorous safety protocols. Your vehicle data recorders and weather instrumentation checks must become second nature before deployment. Prioritize escape route planning over core-punching strategies, maintaining situational awareness of RFD gust fronts and wall cloud rotation patterns.
Storm chasing demands unwavering safety discipline—your instrumentation checks and escape routes must be automatic before confronting severe weather’s lethal realities.
Critical safety parameters include:
- Lightning mitigation: Avoid becoming the tallest object; maintain ground isolation through crouching positions rather than prone spreading
- Tornado positioning: Never shelter under overpasses; seek substantial structures or lie flat in depressions
- Hail avoidance: Bypass storm cores to prevent vehicle damage and injury from baseball-sized projectiles
- Hydroplaning prevention: Route around puddles and flood-prone crossings with current topographic references
The National Weather Service doesn’t endorse chasing—your autonomy demands absolute accountability.
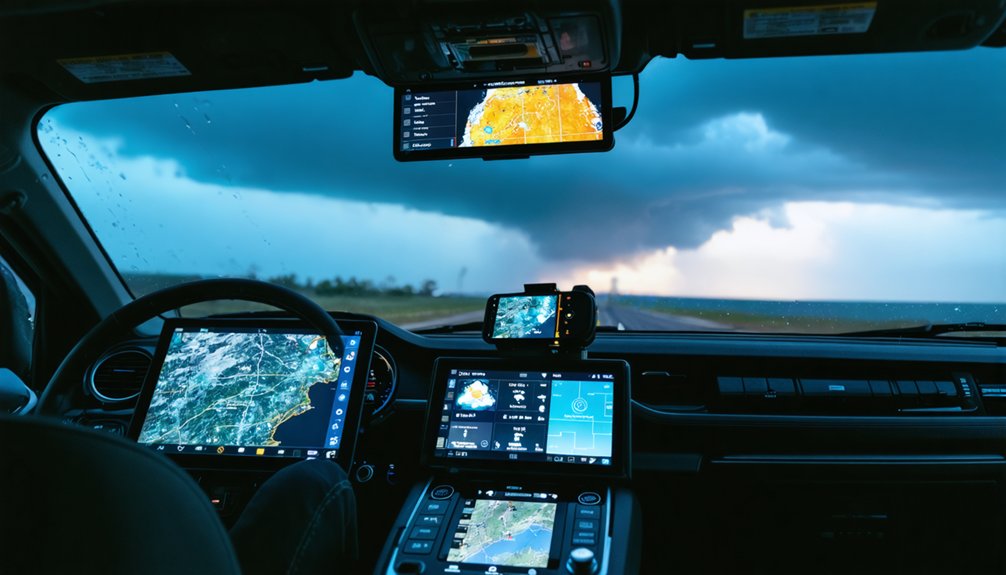
Mobile-Compatible Live Tracking Dashboards
When severe weather converges with your deployment zone, mobile-compatible live tracking dashboards transform your smartphone into a multi-stream command center displaying concurrent chaser positions, Doppler velocity data, and real-time supercell documentation. SevereStudios delivers auto-refreshing streams across Android and iOS platforms, enabling target prioritization through synchronized map-and-list interfaces showing active tornado intercepts.
Storm Chasers Mobile integrates ZoomRadar’s Level 2 Doppler overlays with real-time chaser video feeds, supporting deployment coordination via embedded messaging protocols. Live Storm Chasers transmits notifications when veteran operators activate TIV 2 tornado probes, providing scientific telemetry alongside standard atmospheric parameters.
Storm Tracker’s NOAA alert integration covers 1.4M users across tornado alley states—Oklahoma, Kansas, Texas—with 24/7 radar updates and barometric pressure gradient analysis for mesocyclone identification.
Reading Weather Data From GOES and JPSS Satellites
You’ll access critical satellite data through GOES GeoColor and infrared channels to monitor storm intensity, structure, and evolution in real-time across hemispheric scales.
Water vapor imagery at 6.2-7.3 µm wavelengths reveals mid-to-upper tropospheric moisture transport, jet stream dynamics, and atmospheric stability patterns that drive severe convection.
GOES-16 and GOES-17’s continuous 5-15 minute scanning provides temporal resolution necessary for tracking mesoscale features like overshooting tops, anvil expansion rates, and supercell development across CONUS.
GeoColor and Infrared Imagery
As storm chasers analyze rapidly evolving severe weather, GeoColor and infrared imagery from GOES and JPSS satellites provide the real-time observational foundation for intercepting supercells, derechos, and tornadic systems. Geostationary satellite imagery delivers continuous 5-15 minute updates, revealing cloud structure evolution and convective initiation. Infrared thermal features expose cloud-top temperatures—colder tops indicate stronger updrafts and severe potential.
Key imagery applications for storm interception:
- Band 13 infrared identifies overshooting tops and anvil expansion signaling intensification
- GeoColor daytime composites distinguish boundary interactions and storm-scale cloud features
- GLM lightning density overlays pinpoint electrical activity concentrations marking supercell cores
- JPSS polar coverage fills high-latitude gaps when GOES viewing angles degrade
You’ll combine both systems for all-encompassing situational awareness, tracking target storms from genesis through dissipation across your operational domain.
Water Vapor Moisture Tracking
While GeoColor and infrared imagery reveal cloud structure, water vapor channels expose the invisible atmospheric moisture distribution that governs storm development. You’ll track upper-tropospheric moisture using GOES-R’s 6.2 μm band, which detects water vapor at 15,000-30,000 feet where jets and troughs develop.
The 6.9 μm and 7.3 μm bands penetrate mid-levels, revealing moisture advection and deformation zones critical for convective initiation. Remote sensing techniques measure brightness temperatures from the effective layer—the highest altitude containing detectable water vapor. White regions indicate high humidity beneath potential thunderstorm plumes; dark areas show dry air suppressing development.
GOES-16/17 and CIMSS MIMIC-TPW products enable global moisture forecasting, letting you identify jet streaks, upper vortices, and turbulence zones without cloud interference. You’re tracking atmospheric motion itself as a passive tracer.
Real-Time Hemispheric Storm Views
- Advanced Baseline Imager detects overshooting tops, gravity waves, and above-anvil cirrus plumes indicating violent updrafts
- Lightning mapper tracks rapid flash rate increases signaling intensification 1+ hour before ground-level impacts
- VIIRS Day-Night Band distinguishes lightning strikes and auroral activity through cloud layers
- Storm prediction models integrate JPSS atmospheric soundings for 3-7 day severe weather outlooks with 1-Kelvin accuracy
This synergy between geostationary persistence and polar precision enables autonomous intercept planning.
Road Network Analysis in High-Activity Regions
Road network architecture fundamentally determines chase success rates across the four primary tornado-observing regions in the United States. You’ll find Plains states dominate with interstates I-35, I-40, and I-70 forming critical corridors where attempt-to-success ratios average 1:10 days.
Oklahoma and Kansas roads provide access to 70% of photogenic tornadoes, supported by extensive highway spacing averaging 50 miles for effective storm traversing. The I-44 corridor alone yields 25% of documented events since 1990.
Conversely, Dixie Alley‘s narrower routes and flood-prone infrastructure create significant positioning challenges. Road network maintenance directly impacts your multi-state chase days spanning 500+ miles daily.
Chase vehicle specialization proves essential when maneuvering unpaved secondary roads in high-activity zones, particularly during April-May peak seasons when real-time positioning determines intercept probability.
Stream Verification and Target Confirmation Methods
You’ll verify live streams through dual-polarization radar signatures that confirm debris lofting and rotation velocity thresholds exceeding 40 m/s. Mobile Doppler positioning within 10 km of the circulation enables you to cross-reference crowd-sourced video timestamps with rapid-scan velocity couplets for ground-truth confirmation.
Real-time target assessment requires synthesizing HRRR model output, satellite-detected cloud breaks, and surface boundary intersections to validate storm initiation probability before committing resources.
Live Feed Verification Tools
When storm targets rapidly evolve across multiple jurisdictions, verification tools like Highways & Hailstones’ live stream integration provide real-time visual confirmation of mesocyclone development, precipitation cores, and surface-based rotation. You’ll access server URLs and stream keys through the mobile app’s Setup Streaming interface, enabling broadcast software transmission to live.highwaysandhailstones.com without additional cellular data consumption.
Multi stream simulcasting capabilities include:
- Facebook Profile and Page restreaming alongside primary H&H map destination
- YouTube Channel integration for simultaneous multi-platform broadcasts
- Severe Studios Live Map auto-refresh displays from top chasers tracking supercells
- Frame time indicators monitoring real-time feed latency during tornado intercepts
Interactive chase maps aggregate verification outcomes as you visually confirm whether predicted tornado, hail, or wind targets materialize, eliminating forecast-versus-observation discrepancies through direct meteorological observation.
Real-Time Target Assessment
Live streaming validates atmospheric conditions, but confirming your storm target requires synthesizing multiple verification methods simultaneously. You’ll conduct mesoscale factor analysis by cross-referencing dual-polarization radar signatures with visual wall cloud development and NTDA algorithm probability outputs.
Monitor storm updraft behavior through counterclockwise rotation patterns while positioning mobile Doppler units within suitable range for complete lifecycle mapping. Your phased array radar completes full volume scans in under sixty seconds, revealing structural evolution that static observation misses.
SkyWarn spotter reports triangulate surface-level confirmations against MRMS circulation maps, verifying tornado timing and location accuracy. Dual-Doppler setups stationed forty miles apart provide multi-altitude storm mapping, while debris detection from leaves and insulation confirms ground contact. This integrated approach eliminates false targets and maximizes your intercept success rate.
Frequently Asked Questions
What Permits or Licenses Are Required to Chase Storms Legally?
You’ll find minimal legal restrictions nationwide—no permit requirements exist for general storm chasing. Oklahoma’s SB 158 creates optional Professional Severe Weather Tracker licenses ($500 initial, $250 renewal), granting restricted-area access during severe weather events.
How Much Does Typical Storm Chasing Equipment Cost for Beginners?
Budget beginners bear $2,000-$5,000 initial costs. Your camera gear setup requires $500-$1,000, while on-road vehicle maintenance, fuel ($1,592 annually), communication boosters ($550), and weather instruments total extensively more for expansive chase capabilities.
What Is the Best Season to Start Storm Chasing?
You’ll find late May through early June offers the best start, when ideal weather conditions align with predictable storm formation patterns across the Great Plains. This peak period maximizes your freedom to chase photogenic supercells with highest success rates.
Can Storm Chasers Get Insurance Coverage for Vehicle Damage From Hail?
Yes, you’ll need thorough insurance for hail damage—liability protection won’t cover your vehicle. Review coverage options before deploying into convective zones, ensuring your policy’s active pre-storm. Higher deductibles reduce premiums but increase out-of-pocket costs.
How Do Chasers Earn Income From Their Storm Chasing Activities?
You’ll earn income through footage sales ($500 per submission), paid chase tours ($3,500 per participant), crowdsourced storm data contracts, professional photography work, social media sponsorships, and institutional employment ($50,000-$90,000 annually) while maintaining operational independence.