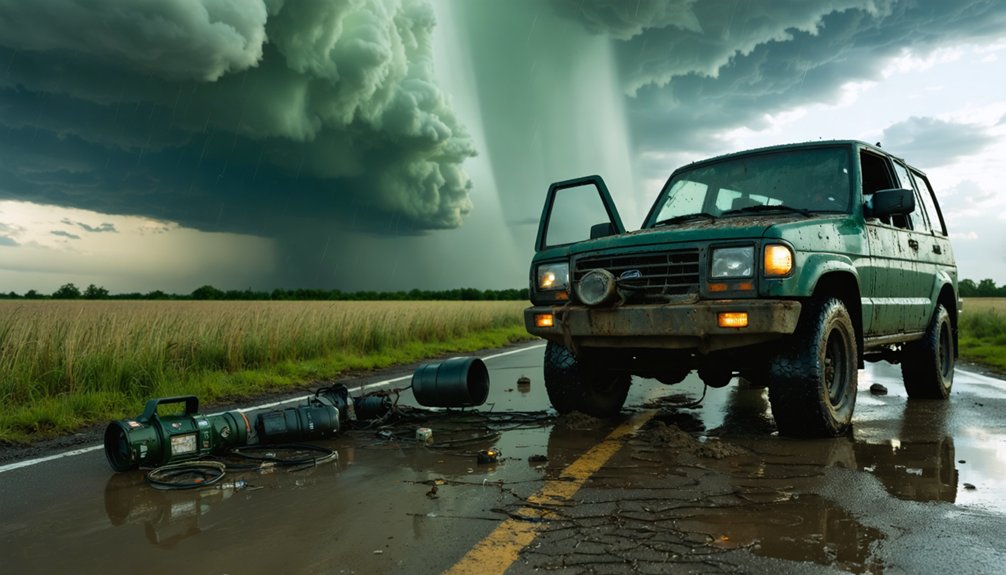
Climate change’s impact on tornadoes isn’t straightforward—you’re seeing fewer tornado days overall since the 1970s, but more tornadoes clustered on active days. The geographic center has shifted eastward from the Great Plains to Dixie Alley, while the traditional spring-summer season now extends into fall and winter. Climate models project 5-15% increases in atmospheric instability (CAPE) per degree of warming, yet simultaneously predict decreasing wind shear, creating conflicting conditions. Understanding these complex atmospheric dynamics requires examining how multiple variables interact.
Key Takeaways
- Climate change increases atmospheric instability (CAPE) by 5-15% per degree Celsius, providing more explosive energy for severe storms.
- Warmer temperatures enable tornadoes during fall and winter months, extending beyond the traditional spring-summer peak season.
- Tornado activity is shifting eastward from Great Plains to Southeast, with Dixie Alley becoming increasingly tornado-prone.
- Wind shear may decrease in warming climate, potentially reducing organized supercells despite higher atmospheric energy availability.
- More tornadoes now concentrate on fewer active days, creating intense outbreak scenarios rather than distributed tornado events.
Historical Patterns: How Tornado Activity Has Shifted Over Decades
Detection technology improvements, particularly Doppler radar deployment since 1997, enable more accurate identification of weaker tornadoes in populated regions.
Population growth impacts reporting rates markedly, as expanding Southeast communities provide more observers.
In 2024, Ohio recorded 71 tornadoes, exceeding Oklahoma’s 69-tornado annual average.
Historical analysis confirms half of America’s deadliest tornadoes occurred outside traditional boundaries, chiefly in southern states. March 2024 saw 239 confirmed tornadoes, breaking the previous record set in March 2022.
The first reported tornado of 2024 occurred in Europe on January 3, highlighting the global nature of tornado activity.
The Science Behind Atmospheric Instability and Severe Storms
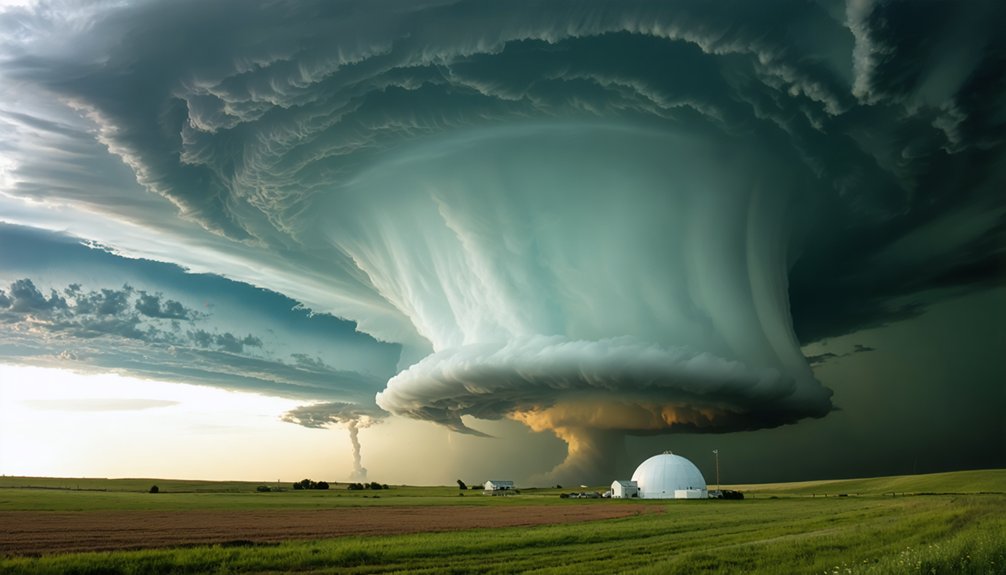
Convective Available Potential Energy (CAPE) quantifies atmospheric instability by measuring the buoyancy available to rising air parcels, with climate projections indicating increases of 5-15% per degree Celsius of warming. This enhanced instability amplifies supercell development, yet observational data reveal a competing dynamic: vertical wind shear—critical for mesocyclone formation—may simultaneously weaken in certain regions as the temperature gradient between equator and poles decreases.
You’re observing a complex interplay where rising CAPE doesn’t guarantee proportional tornado increases, as favorable conditions require both sufficient instability and adequate shear to converge spatially and temporally. The vertical shear generates both crosswise and streamwise spin in the horizontal plane, which updrafts then tilt into the vertical axis to initiate mesocyclone rotation. This vertical stretching mechanism transforms horizontally rotating air into the organized circulation patterns that distinguish supercells from ordinary thunderstorms.
Rising CAPE Fuels Supercells
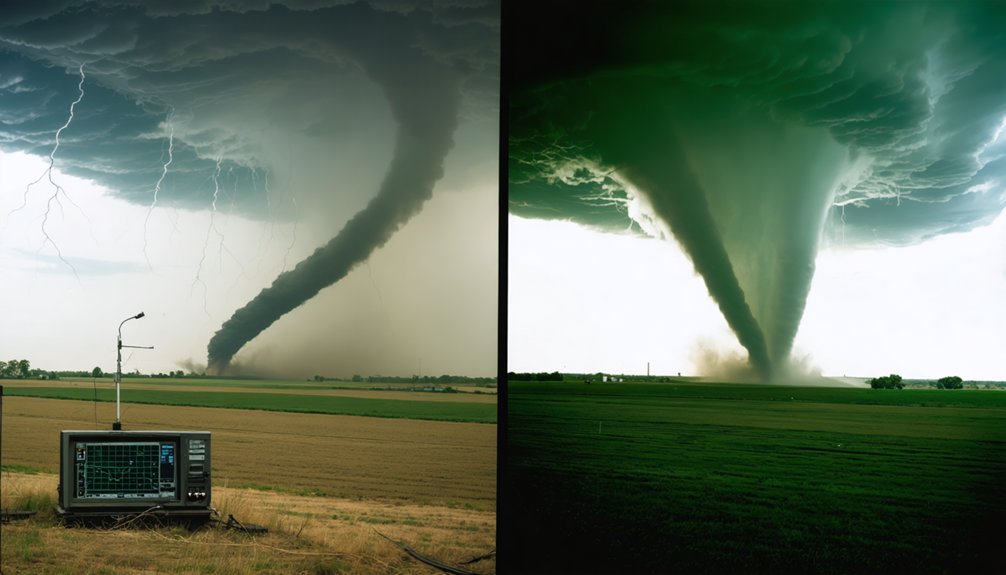
When atmospheric conditions align to create instability, the resulting energy available for thunderstorm development becomes quantifiable through a metric called Convective Available Potential Energy, or CAPE. You’ll find CAPE values expressed in joules per kilogram, ranging from zero to over 5,000.
Since 1979, atmospheric instability has increased measurably, with CAPE trending upward alongside warming temperatures. When you’re analyzing severe weather potential, CAPE above 2,500 J/kg signals strong instability, while values exceeding 4,000 J/kg indicate extreme conditions. Parts of the eastern U.S. have experienced up to 10-15 more days of high CAPE values during spring and summer seasons.
However, CAPE alone won’t predict tornado formation—you’ll need wind shear to generate rotation. Radar reflectivity patterns and convective inhibition values provide additional context, but surface-based instability with low-level buoyancy remains essential for tornadic supercells. Short, wide CAPE areas with normalized CAPE values exceeding 0.3 m/s in the lower part of the atmosphere can produce thunderstorms with strong, low-altitude updrafts and a greater chance of tornadoes.
Wind Shear Offsetting Effects
While high CAPE values create the explosive energy necessary for severe thunderstorm development, they’ll produce only disorganized clusters of storms without adequate wind shear to structure the convective environment.
You need directional shear—where winds change direction with altitude—to generate the rotational forces that spawn tornadoes. Speed shear tilts updrafts and separates rain-cooled outflow from inflow regions, preventing premature storm collapse.
However, climate projections show decreasing wind shear trends in tornado-prone regions, where jet influences may weaken as polar temperature gradients diminish. This creates a paradox: rising atmospheric instability countered by declining shear.
When shear overrides other favorable conditions, you’ll see fewer organized supercells despite higher energy availability. Wind shear also determines severe thunderstorm longevity, as sustained rotation requires persistent directional changes throughout the atmospheric column. The combination of moisture, instability, lifting, and wind shear represents the four key components required to transform an ordinary thunderstorm into a severe thunderstorm capable of producing damaging weather. Understanding this offsetting relationship remains critical for evaluating future tornado frequency.
Geographic Migration: From Tornado Alley to Dixie Alley
Over the past several decades, the geographic center of tornado activity in the United States has migrated eastward from the traditional Great Plains region into the Southeast. Research confirmed in 2016 statistically documented the emergence of new centers, particularly around Alabama.
You’ll find Dixie Alley now extends from Mississippi through Tennessee and Kentucky to southern Indiana, showing increased tornado numbers while Oklahoma experiences declining frequency. The dry line boundary has shifted 140 miles eastward since the late 1800s, fundamentally altering where severe storms develop. Meanwhile, the traditional Tornado Alley in the central plains has experienced a notable decrease in both total tornado numbers and tornado days.
Population density trends complicate analysis in southeastern states, explaining roughly 28% of annual tornado frequency variance. However, Alabama, Mississippi, and Kentucky demonstrate greater than 30% variance explained by anthropogenic covariates, requiring careful interpretation of apparent increases. The shift brings tornadoes into denser population centers, where entire metro areas rather than small towns face the threat of severe weather events.
Seasonal and Timing Changes in Tornado Occurrence
Beyond geographic shifts, tornado timing patterns across the United States have undergone measurable transformations that challenge historical seasonal norms. You’ll observe increased variability in when tornadoes strike, with data showing fewer tornado days overall since the 1970s, yet more tornadoes concentrated on active days. This clustering of outbreaks creates denser temporal groupings—outbreaks exceeding 30 tornadoes in single days are rising.
The traditional spring-summer peak now extends into fall and winter months. December 2021’s Mid-Mississippi Valley tornadoes exemplified this shift, fueled by record warm temperatures. Warmer, humid conditions enable atmospheric instability during historically quiet periods.
While natural oscillations like La Niña influence year-to-year variations, projections indicate medium confidence for longer convective storm seasons. However, high variability complicates definitive attribution to human-caused warming.
What Climate Models Predict for Future Supercell Development
Climate models project a 6.6% nationwide increase in supercell frequency by century’s end, with notable regional variations across the United States and Europe.
You’ll observe substantial early-season intensification—supercells in April could increase by 66% under business-as-usual scenarios—while late summer months show marked decreases in the Great Plains due to enhanced convective inhibition.
These projections stem from high-resolution simulations operating at 2.2 km precision, which link supercell proliferation to rising atmospheric CAPE (Convective Available Potential Energy) values in warming environments.
Projected Supercell Frequency Increases
As global temperatures continue rising, climate models project measurable shifts in supercell thunderstorm frequency across both the United States and Europe. Radar-based tracking reveals an 11% increase in European supercell activity at 3°C warming, while U.S. projections show 7% growth under moderate emissions and 15% under high-emissions scenarios.
You’ll notice significant regional variations—eastern U.S. regions expect more numerous supercells, whereas traditional Tornado Alley areas may see declines. Europe’s northern Alps could experience 50% increases, while moisture availability shifts drive a 30% decrease across the Iberian Peninsula.
High-resolution simulations spanning 15-year epochs confirm these trends, with the strongest supercells’ cumulative footprint expanding 26-60% by century’s end. These changes fundamentally alter where and when severe weather threatens your communities.
Regional and Seasonal Shifts
Europe’s climate future reveals stark geographical contrasts in supercell development, with Alpine regions poised for dramatic increases while Mediterranean areas face substantial declines. At 3°C warming, you’ll observe up to 50% more supercell activity on the Alps’ northern side, while the Iberian Peninsula and southwest France experience reductions. These regional comparisons demonstrate climate change’s uneven impacts:
- Central and Eastern Europe: notable supercell increases projected
- Alpine region: 50% rise compared to pre-industrial levels
- Iberian Peninsula: substantial decreases expected
- Southwest France: reduced supercell activity anticipated
Climate modeling limitations remain significant—current 10 km mesh models approximate storm environments but miss critical sub-scale shear variations. The scClim project’s 2.2 km resolution advances precision, though some proxy studies contradict Southwest Europe projections by not specifically targeting supercell thunderstorms.
CAPE Growth Under Warming
How will atmospheric instability shape tomorrow’s severe weather landscape? Climate models project increasing CAPE values as global warming drives lower troposphere moistening, creating more frequent environments conducive to supercell development. You’ll see CAPE rise primarily through enhanced water vapor in the lower atmosphere, with studies like Trapp et al. (2009) and Diffenbaugh et al. (2013) quantifying these shifts.
On high-CAPE days, vertical wind shear remains relatively stable, maintaining supercell favorability despite overall shear decreases. However, CAPE CIN relationships introduce complexity—rising convective inhibition may counteract frequency increases even as severity intensifies.
Observational data since 1979 confirms 10-15 additional high-CAPE days annually across the eastern U.S., validating model projections. Yet coarse grid resolutions leave convection initiation processes unresolved, demanding cautious interpretation of these atmospheric dynamics.
The Debate: Reconciling Conflicting Data and Projections
The conflicting evidence includes:
- Kansas data (1950-2016) showing no relationship between tornado frequency and temperature increases
- Weak negative correlation between climate indices and tornado intensity
- Novel modeling suggesting potential increases in tornado intensity from human-induced changes
- Predictions of less frequent but more intense severe thunderstorms
Current climate models can’t accurately simulate tornadoes due to their small scale. While warmer conditions may increase atmospheric instability, they could simultaneously decrease wind shear—offsetting any intensification gains. You’ll need improved models and longer observational records before drawing definitive conclusions.
Frequently Asked Questions
How Can Individuals and Communities Better Prepare for Tornado Risks?
You’ll strengthen survival through systematically structured disaster preparedness plans, designating dedicated shelter spaces, and drilling regularly. Communities construct resilient community storm shelters while you maintain emergency supplies, monitor weather alerts, and coordinate with trained response teams for ideal protection.
Do Early Warning Systems Detect Tornadoes Earlier Now Than Before?
Yes, you’ll now receive warnings approximately 30 minutes before tornadoes versus just three minutes in 1978. Improved sensor technology and enhanced data modeling have increased detection rates from 22% to over 90%, giving you vital time to protect yourself.
How Does Tornado Damage Compare Between Rural and Urban Areas?
Urban tornadoes kill 5-16 times more frequently than rural ones. You’ll find tornado damage impacts concentrate where population density meets debris hazards, though socioeconomic factors in tornado risk—like mobile home prevalence and building codes—significantly influence your vulnerability regardless of location.
Are Building Codes Adapting to Increased Tornado Threats in New Regions?
Yes, you’ll find building code requirements are evolving through 2024 IBC adoption east of the Continental Divide, though regional zoning policies lag 3-10 years in implementation, leaving many jurisdictions without mandated tornado protections for residential structures.
What Role Does El Niño Play in Tornado Formation Patterns?
El Niño dramatically reshapes your tornado landscape through oscillation patterns that shift the jet stream southward, reducing springtime activity across the Great Plains. You’ll observe tornado seasonality shifts with fewer intense events, averaging just 8.2 F4-F5 tornadoes annually.
References
- https://www.climatecentral.org/climate-matters/severe-storm-supercell-and-tornado-trends-2023
- https://www.heritage.org/environment/report/twisters-and-trends-analysis-us-tornado-activity-and-climate-change
- https://www.climatesignals.org/climate-signals/tornado-risk-increase
- https://www.congress.gov/119/meeting/house/118088/documents/HHRG-119-II15-20250402-SD001.pdf
- https://www.c2es.org/content/tornadoes-and-climate-change/
- https://www.weather.gov/lmk/niu_tornado_frequency_study
- https://en.wikipedia.org/wiki/List_of_United_States_tornadoes_from_January_to_March_2025
- https://teamrubiconusa.org/news-and-stories/tornado-alley-us-tornadoes-around-the-world/
- https://www.tornadopath.com/tornado-alley
- https://www.ncei.noaa.gov/access/monitoring/tornadoes/