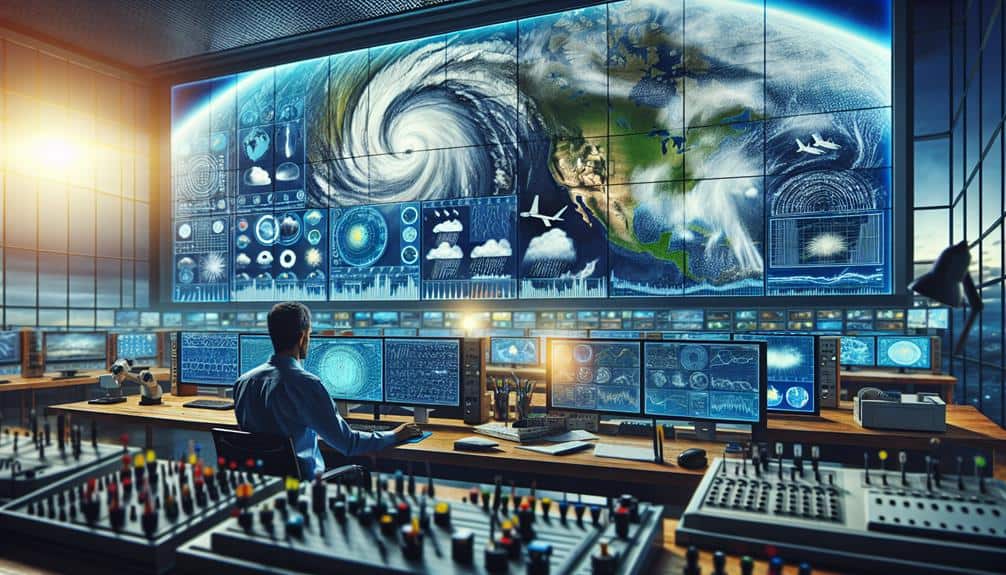
For storm chasers, we rely on top visualization tools like radar data visualization to analyze storm structures, track movement, and predict severe weather events. Satellite imagery tools offer a wide perspective, providing real-time data for tracking storm systems and understanding cloud patterns. Weather forecast models deliver high-resolution predictions by leveraging ensemble forecasting and historical data. Real-time tracking software enables instant atmospheric monitoring and predictive analytics, essential for precise storm detection. Additionally, analyzing historical storm data helps us identify patterns and improve predictive models. By incorporating these tools, we're better prepared and informed to tackle the challenges of storm chasing.
Key Points
- Radar Data Visualization provides detailed storm structure analysis and accurate tracking of storm movement.
- Satellite Imagery Tools offer broad perspectives and real-time data on atmospheric phenomena and storm evolution.
- Weather Forecast Models predict atmospheric conditions using high-resolution data and ensemble forecasting.
- Real-Time Tracking Software monitors and visualizes atmospheric conditions instantly for precise storm detection and predictive analytics.
Radar Data Visualization
Radar data visualization frequently enables us to analyze precipitation patterns and storm structures with high accuracy and real-time updates. By leveraging radar technology, we can track storm movement, identify precipitation intensity, and predict severe weather events with remarkable precision. This allows us to make informed decisions, potentially saving lives and property.
When observing precipitation patterns, radar data helps us identify areas of heavy rainfall, hail, or snow. We can monitor the development and dissipation of these patterns over time, providing valuable insights for weather forecasting. The ability to visualize storm movement in real-time enhances our understanding of how storms evolve and interact with their environment.
For severe weather monitoring, radar data is essential in tornado detection. By analyzing radar signatures such as hook echoes and velocity couplets, we can identify potential tornado formation. This early detection is crucial for issuing timely warnings and enabling people to seek shelter. Additionally, radar data helps us understand the structure of supercell thunderstorms, which are often the precursors to tornadoes.
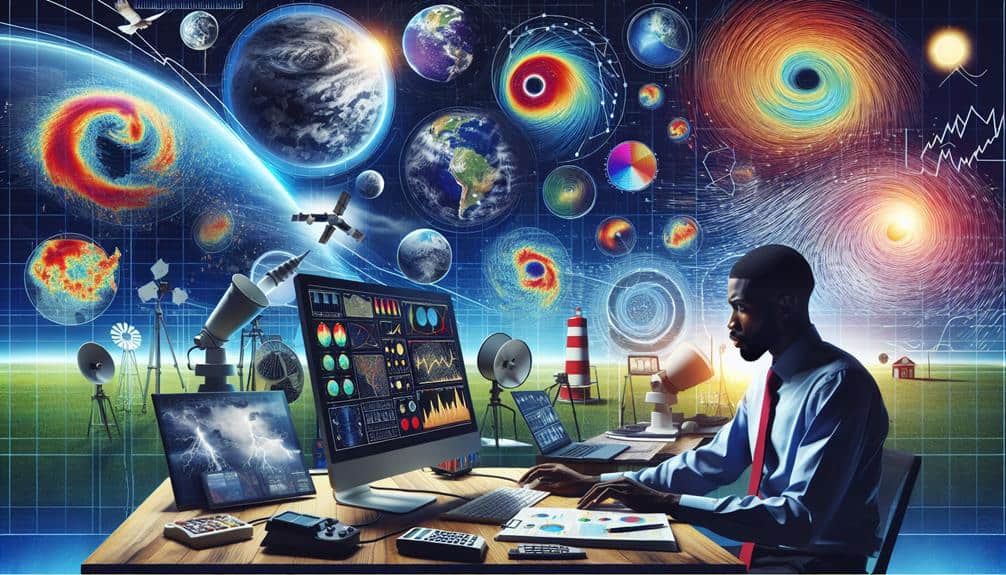
Satellite Imagery Tools
While radar data provides real-time insights into precipitation and storm dynamics, satellite imagery tools offer a broader perspective on atmospheric phenomena and cloud formations. By leveraging high-resolution satellite images, we can analyze detailed cloud patterns and track the development of storm systems over vast regions. These tools allow us to observe the structure and movement of clouds, providing essential information on storm evolution.
Satellite imagery platforms like GOES-16 and Himawari-8 offer near real-time data, enabling us to monitor changes in cloud formations and wind speeds. GOES-16, for instance, provides images every 5 minutes, allowing us to track rapid developments in storm systems. By examining these images, we can identify key features such as cumulonimbus clouds, which are often associated with severe weather.
Furthermore, satellite-derived wind speed data helps us understand the dynamics of storm systems. By analyzing the motion of clouds in sequential images, we can estimate wind speeds at various altitudes. This data is crucial for predicting storm intensity and potential impact areas.
Weather Forecast Models
Weather forecast models employ sophisticated algorithms and vast amounts of data to predict atmospheric conditions with increasing accuracy. We rely on numerical models that simulate the atmosphere's behavior based on initial conditions and physical laws. These models, such as the Global Forecast System (GFS) and the European Centre for Medium-Range Weather Forecasts (ECMWF), utilize ensemble forecasting to provide a range of possible outcomes. By running multiple simulations with slightly varied initial conditions, ensemble forecasting helps us understand the potential spread and uncertainty in predictions.
Our analysis of climatological trends is pivotal for identifying patterns that may influence severe weather events. For instance, studying historical data allows us to determine the likelihood of tornado outbreaks during specific periods. These trends, combined with real-time model outputs, enable us to anticipate and prepare for severe weather with greater precision.
Numerical models are indispensable for storm chasers. They offer high-resolution data on wind speed, atmospheric pressure, and precipitation, which are vital for making informed decisions in the field. By leveraging ensemble forecasting and understanding climatological trends, we gain the freedom to chase storms with a higher degree of confidence and safety.
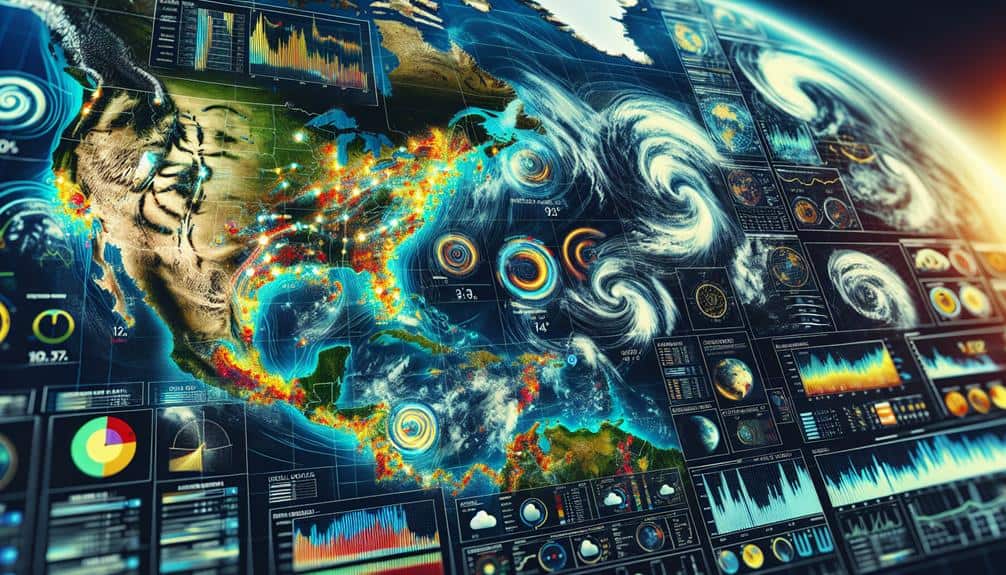
Real-Time Tracking Software
Real-time tracking software empowers meteorologists to monitor atmospheric conditions instantly, enabling rapid and accurate responses to developing weather events. With these tools, we can achieve precise storm detection by leveraging continuous data feeds from satellites, radar systems, and weather stations. This real-time data integration allows us to pinpoint storm formation, intensity, and trajectory with a high degree of accuracy.
Live mapping capabilities are essential in this scenario, as they provide visual representations of meteorological data that can be analyzed quickly. These maps update dynamically, displaying vital information such as wind speed, precipitation rates, and storm cell movement. By using live mapping, we can overlay various data layers to assess potential impacts on specific regions, which is invaluable for decision-making processes during severe weather events.
Advanced algorithms within these software platforms facilitate predictive analytics, giving us the ability to forecast storm development in near real-time. This empowers storm chasers and emergency responders with actionable insights, ensuring safety and strategic positioning. Tools such as GRLevel3, RadarScope, and AWIPS II exemplify cutting-edge real-time tracking software, combining robust data analytics with intuitive interfaces, thereby granting us the freedom to act swiftly and decisively in the face of volatile weather conditions.
Historical Storm Data Analysis
Analyzing historical storm data enables us to identify patterns and trends that can enhance our predictive models and improve future weather forecasts. By diving into decades of storm records, we can perform detailed trend analysis to see how storm frequency, intensity, and paths have evolved over time. This is vital for climate change analysis, as it allows us to quantify how shifting weather patterns are impacting storm behavior.
We can also conduct impact assessment studies to determine the societal and economic effects of past storms. These assessments inform disaster preparedness strategies, ensuring communities are better equipped to handle future events. High-resolution visualizations help us pinpoint areas that have historically been most vulnerable, guiding resource allocation and emergency planning.
Advanced tools offer the capability to overlay various datasets, such as sea surface temperatures and atmospheric pressure systems, facilitating a multi-dimensional view of storm dynamics. By leveraging these tools, we can make more accurate predictions and develop robust models that account for both historical trends and future projections.
The freedom to explore, analyze, and interpret this data empowers us to make informed decisions that can save lives and reduce economic losses.
Frequently Asked Questions
What Are the Costs Associated With These Meteorological Visualization Tools?
When analyzing the costs, we observe a range from free options to premium subscriptions. A detailed cost comparison reveals that while some tools offer basic functionalities for free, advanced features can be pricey, impacting our budget decisions.
How User-Friendly Are These Tools for Beginners in Storm Chasing?
Ironically, the "user-friendly" tools require a steep learning curve. However, with ample training resources and robust support options, we can master the technical skills needed. It's all about freedom through knowledge and analytical precision.
Are There Mobile App Versions of These Visualization Tools Available?
Yes, many of these tools have mobile app versions. They offer data accuracy, real-time updates, and offline accessibility. Plus, they include customization options, allowing us to tailor the data to our specific storm-chasing needs.
Do These Tools Integrate With Social Media Platforms for Sharing Data?
Yes, these tools integrate with social media platforms for sharing data. We can use interactive maps and facilitate data collaboration seamlessly, empowering us to share real-time updates and engage with our community more effectively.
What Hardware Requirements Are Needed to Run These Visualization Tools Effectively?
Imagine our computer as a high-performance race car; for peak performance enhancement, we need a powerful CPU, ample RAM, and a robust GPU. System compatibility with modern operating systems guarantees we can chase data without constraints.