Storm chasers are concerned because climate change is fundamentally altering severe weather patterns you’ve relied on for decades. The tornado epicenter has shifted 110 miles eastward into densely populated southeastern states, while strong tornado frequency doubled in Arkansas, Tennessee, Louisiana, Alabama, and Mississippi since 1990. You’re also tracking a 71% increase in wintertime tornadoes and observing more clustered outbreak events. These geographic and temporal shifts create unprecedented operational challenges and substantially elevated casualty risks that demand new forecasting methodologies and safety protocols.
Key Takeaways
- Tornadoes now occur in clusters during outbreaks and throughout the year, creating unpredictable and dangerous conditions for chasers.
- The geographic epicenter shifted eastward into densely populated, vegetated southeastern areas, reducing visibility and increasing operational hazards.
- Extended severe weather seasons mean storm chasers face operational risks 4-6 weeks beyond historical boundaries on both ends.
- Accurate tornado prediction requires reliable ground-truth data collection, which becomes more critical as storm patterns intensify and shift.
- Increased storm intensity and frequency create additional challenges for professional chasers who depend on predictable seasonal patterns.
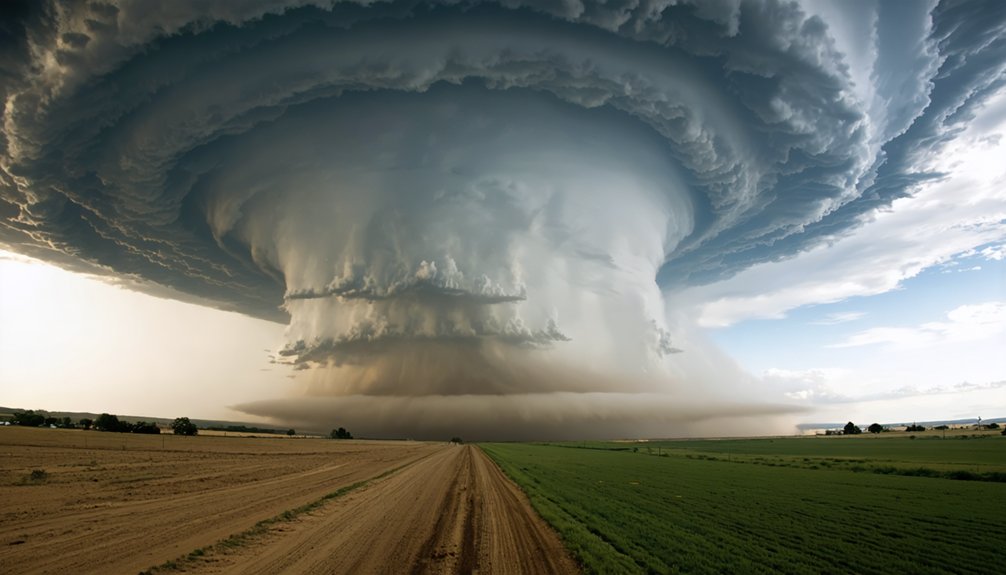
Tornado Alley Is Moving Eastward Into More Populated Areas
Over the past two decades, the geographic epicenter of tornado activity has undergone a measurable eastward migration from the traditional Great Plains corridor into the Mississippi River valley and Southeast.
You’ll find that strong tornado frequency has more than doubled across Arkansas, Tennessee, Louisiana, Alabama, and Mississippi since 1990, while Nebraska, Kansas, Oklahoma, and Texas experienced a 30% reduction. The decadal centroid of strong tornado tracks has shifted 110 miles eastward over three decades.
This movement shifts severe weather into shifting population centers with increased tree coverage, fundamentally altering risk dynamics. The Southeast’s denser population distribution, combined with vegetation that obscures visual confirmation, creates substantially higher casualty potential than the sparsely populated Plains—a trend already reflected in historical fatality data.
Storm Intensity Is Increasing Due to Warmer Ocean Temperatures
Warmer ocean temperatures amplify tropical storm intensity by increasing atmospheric water vapor content through enhanced evaporation rates—approximately 7% more moisture per 1°C rise in sea surface temperature.
When ocean temperatures exceed 28°C, storms extract substantial heat energy and moisture from the upper ocean layer, directly fueling higher wind speeds and precipitation rates. This mechanism enabled Hurricane Milton’s rapid intensification of 120 mph within 36 hours, demonstrating how elevated sea surface temperatures compress development timelines and extend storm activity beyond traditional seasonal boundaries.
Moisture Fuels Extreme Storms
As greenhouse gas emissions trap heat in Earth’s atmosphere, the oceans absorb most of this thermal energy, creating warmer sea surface temperatures that directly intensify hurricanes. You’re witnessing a fundamental shift in atmospheric physics: warmer air holds approximately 7 percent more moisture per degree Celsius of warming.
This increased atmospheric instability transforms hurricanes into more devastating precipitation events. Climate attribution studies have quantified moisture contributions to Hurricane Sandy, Snowmaggedon, and Boulder floods—demonstrating measurable human influence. Models project significant rainfall rate increases by 2100, amplifying hurricane flooding risks when storms make landfall.
The mechanism is straightforward: enhanced water vapor provides latent heat energy that accelerates wind speeds while simultaneously increasing precipitation totals. You’re observing atmospheric thermodynamics in real-time, where each temperature increment fundamentally alters storm behavior patterns.
Beyond Traditional Storm Season
Climate-driven ocean warming has fundamentally altered hurricane behavior patterns, with quantified wind speed increases demonstrating measurable intensification beyond historical norms. You’re witnessing documented evidence: 80% of Atlantic hurricanes from 2019-2023 intensified one category higher, averaging 18 mph faster winds due to anthropogenic ocean heat accumulation.
The upper ocean’s thermal structure now enables late-season storms to access deeper warm layers, sustaining rapid intensification previously confined to peak months. This extended energy reservoir supports increased precipitation patterns and changing storm tracks beyond traditional August-September windows.
Milton’s 120 mph intensification over 36 hours exemplifies conditions 400-800 times more probable under current climate forcing. Seven 2024 hurricanes jumped categories from elevated sea surface temperatures alone—quantifiable proof that your storm-tracking parameters require recalibration for unprecedented thermodynamic environments.
Traditional Tornado Seasons Are Extending Beyond Normal Timeframes
You’re observing a fundamental shift in tornado seasonality as atmospheric warming extends severe weather risks beyond the historical spring-summer peak into previously quiescent months.
The December 2021 Mid-Mississippi Valley outbreak, which produced at least 75 fatalities in Kentucky, exemplifies this expansion driven by anomalous early-winter temperature records across the continental United States.
Climate projections indicate that enhanced atmospheric instability from increased moisture availability will continue broadening the temporal window for tornadic activity, effectively creating year-round severe weather potential in regions historically experiencing distinct seasonal patterns.
Storms Now Year-Round
When storm chasers calibrate their equipment in December and deploy to regions experiencing atmospheric instability, they’re witnessing a fundamental departure from historical tornado seasonality patterns.
Record warm temperatures during early winter months create atmospheric conditions previously confined to spring and summer peaks. These off season tornado patterns demonstrate how warmer air masses extend favorable thermodynamic environments into periods historically too cold for supercell development.
You’re observing changing climate signatures as atmospheric instability persists year-round rather than concentrating within traditional March-through-June windows. The data reveals tornadoes forming across all twelve months, eliminating the predictable dormancy periods that characterized decades of historical records.
This continuous threat landscape fundamentally alters risk assessment frameworks and demands persistent vigilance rather than seasonal preparedness cycles.
Off-Season Tornado Outbreaks
Statistical analyses reveal a 71% increase in wintertime tornadoes (December through February) when comparing the 1980–2000 baseline to the 2001–2022 period, with tornado outbreaks occurring two to three times more frequently across southeastern U.S. regions during winter months over the past four decades.
You’re witnessing an uninterrupted active season extending from late fall through early summer, fundamentally altering preparedness protocols.
February through April 2025 demonstrated well above-average tornado activity per preliminary Storm Prediction Center data, while March and April experienced 36% and 67% increases respectively.
These nontraditional storm patterns correlate with elevated CAPE values and La Niña-driven atmospheric configurations favoring severe convection. Climate forcing mechanisms push air mass boundaries beyond historical norms, creating tornado-favorable environments when communities traditionally expect dormant periods, compromising your ability to anticipate threats using conventional seasonal frameworks.
Extended Severe Weather Risks
The traditional May-June tornado season peak has expanded into a year-round threat pattern, with severe weather windows now extending 4-6 weeks beyond historical boundaries on both seasonal endpoints.
You’re facing atmospheric conditions that trap water vapor later into autumn and earlier in spring, generating extended precipitation patterns that fuel severe convection outside conventional parameters.
The warming Arctic has destabilized jet stream dynamics, allowing polar vortex disruptions to create temperature gradients necessary for supercell formation during atypical months.
These temporal shifts compound your operational risks—chasing protocols designed for defined seasonal windows now require year-round vigilance.
Enhanced flood risks from intensified precipitation events further complicate chase logistics, as infrastructure designed for historical norms fails under nonlinear compound extremes exceeding engineered thresholds.
More Tornadoes Are Occurring in Clusters During Single Outbreaks
Storm chasers have witnessed a striking shift in tornado occurrence patterns: while the total number of days with at least one F1+ tornado declined between 1950 and 2014, days featuring over 30 F1+ tornadoes increased in frequency. This increasing tornado density represents a fundamental change in outbreak dynamics.
Analysis of 890 tornado clusters from 1994 to 2022 revealed concentrated geographical patterns, with Osage County, Oklahoma recording 107 clusters—the highest density nationwide. Tornadoes are occurring closer together spatially during single events, though scientists haven’t definitively linked these clustering influences on tornado behavior to climate change. The trends remain robust despite high year-to-year variability, and researchers can’t exclude greenhouse gas concentrations as contributing factors. Current climate models can’t simulate tornadoes with sufficient accuracy to establish direct causation.
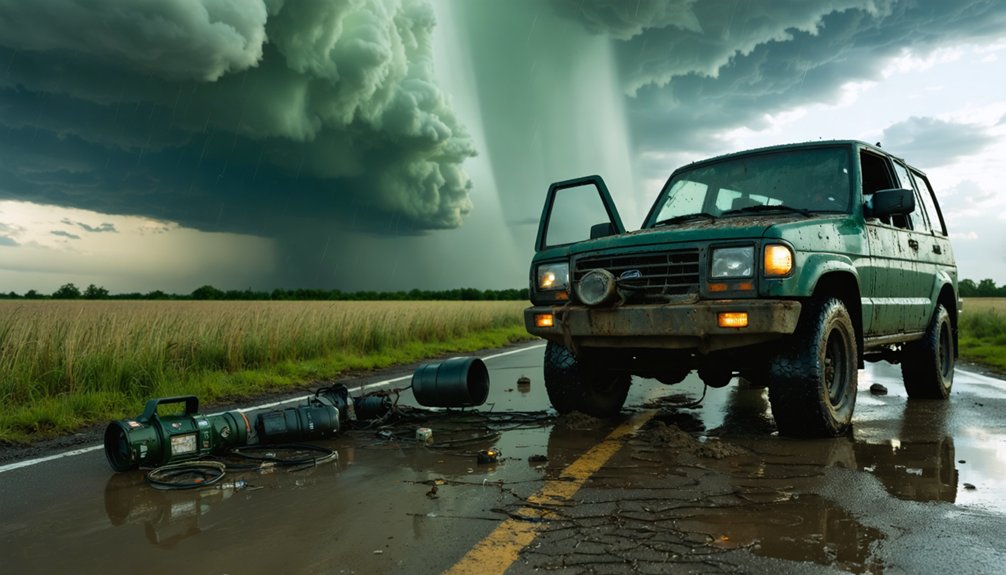
Ground-Truth Data Collection Is Becoming More Critical for Scientists
Accurate tornado prediction depends on thorough ground-truth data—surface observations that validate atmospheric models and fill critical monitoring gaps across the United States. You’ll find mesonets essential for improving data assimilation, as these automated networks detect storm boundaries and analyze near-storm environments in real-time. Their sensors tracking humidity, temperature, and precipitation establish pre-event baselines for post-severe weather comparisons.
Evaluating sensor reliability becomes critical when spatiotemporal machine learning techniques process surface observations alongside NARR data to determine tornadogenesis probability. Remote visual monitoring via drones now enables rapid on-site data collection without personnel risk.
In rural areas with limited historical records due to geographic isolation and funding shortages, these ground-truth observations prove indispensable for training algorithms that project future temperature trends and severe weather patterns.
Underprepared Communities Face Greater Vulnerability to Severe Weather
While storm chasers gather critical atmospheric data in real-time, they’re increasingly documenting a parallel crisis: the disproportionate vulnerability of underprepared communities to severe weather events. Underserved populations face compounding risk factors that amplify storm impacts. Approximately 70 percent of Superfund sites lie within one mile of public housing in low-income communities of color, with 60 percent in flood-vulnerable zones.
Hurricane Harvey data revealed only 17 percent of homeowners in the hardest-hit counties carried flood insurance—coverage chiefly held by wealthier households. Aging infrastructure can’t withstand climate-driven weather intensification, while financial barriers prevent storm-proofing and safe evacuation. Rural areas experience delayed emergency response and inadequate communication networks.
You’ll find disproportionate impacts extending to individuals with disabilities, who face mobility constraints and shelter inadequacies during evacuation scenarios.
Building Codes and Storm Shelters Need Updates in Newly Affected Regions
You’ll find that the 2023 ANSI/ICC 500 standard now designates 23 states—from Minnesota to Louisiana and Texas to New York—as requiring 250 mph wind-resistant storm shelters in schools and emergency facilities, yet many southeastern jurisdictions haven’t adopted these prescriptive IBC Section 423 mandates despite expanding tornado-prone zones.
Regional code adoption lags behind the meteorological reality: areas experiencing increased windstorm frequency since 2015 often lack enforcement mechanisms for shelter compliance, creating permit approval gaps where new construction proceeds without adequate debris impact resistance or pressure differential protection.
This disparity between updated engineering standards and local implementation means you’re seeing communities with outdated infrastructure unable to refuse permits or issue stop-work orders for non-compliant projects, even as the 2026 code cycle approaches.
Outdated Infrastructure in Southeast
Infrastructure designed for historical climate patterns now faces catastrophic failure risks as storm intensification outpaces protective system capabilities across newly vulnerable regions.
You’ll find that delayed project approval hampers critical flood protection—Aberdeen and Hoquiam’s $160.5 million levee system won’t see procurement documents until late 2026, leaving thousands of properties exposed.
Military installations exemplify this vulnerability: Offutt Air Force Base‘s 2019 flooding revealed that levee systems designed for 20th-century hydrological conditions can’t handle today’s precipitation volatility.
Out of date vulnerability assessments perpetuate these risks, as demonstrated by persistent maintenance backlogs documented in Government Accountability Office reports.
When planning assumptions ignore evolving climate data, you’re left with infrastructure that’s obsolete before construction completes, particularly across the Southeast’s expanding high-risk zones.
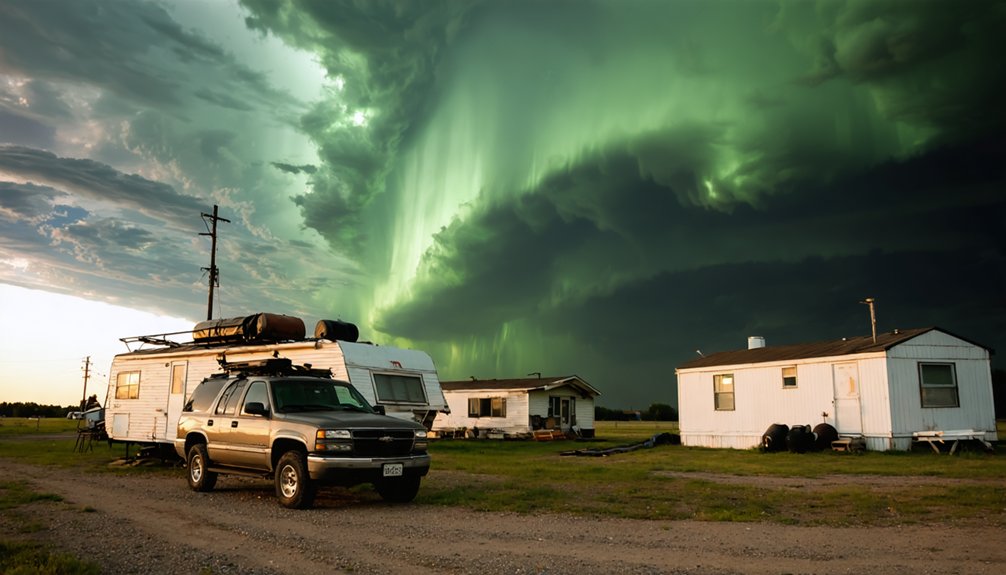
Shelter Access Gaps Widening
As tornado risk zones expand eastward beyond traditional Great Plains corridors, communities in Kentucky, Tennessee, and surrounding states face dangerous shelter deficits that building codes haven’t addressed.
You’ll find rural populations particularly vulnerable—manufactured homes offer minimal wind resistance while public sheltering infrastructure remains nonexistent in many counties. Shelter equity issues emerge when residents receive fewer than ten minutes’ warning yet lack ICC 500-compliant protection meeting 250 mph wind resistance standards.
Building departments in newly affected regions haven’t adopted International Building Code provisions requiring storm shelters for new construction. Meanwhile, inadequate preparedness resources plague rural emergency management departments, which depend heavily on federal assistance post-impact.
High water tables compound accessibility challenges, adding $15,000-$30,000 in waterproofing costs that economically constrained communities can’t absorb without regulatory mandates driving systematic shelter implementation.
Regional Code Standards Lagging
While the 2024 International Building Code introduced tornado wind load design criteria for the first time in U.S. building code history, only 29% of tornado-prone jurisdictions have adopted updated building standards incorporating these provisions—a mere 6% increase from the previous year.
You’re witnessing critical infrastructure gaps emerge as climate patterns shift tornado risks into previously unaffected regions. Building code enforcement remains inconsistent across state lines, with many jurisdictions operating under standards 3–10 years outdated.
The implementation barriers you’ll encounter include:
- Risk Category III and IV structures (schools, hospitals) now require tornado-resistant design east of the Continental Divide
- Individual jurisdictions maintain adoption authority, creating patchwork coverage
- Regional adoption incentives remain insufficient to accelerate compliance timelines
Without coordinated standards, you’re left traversing fragmented protection levels determined by arbitrary municipal boundaries rather than actuarial risk assessments.
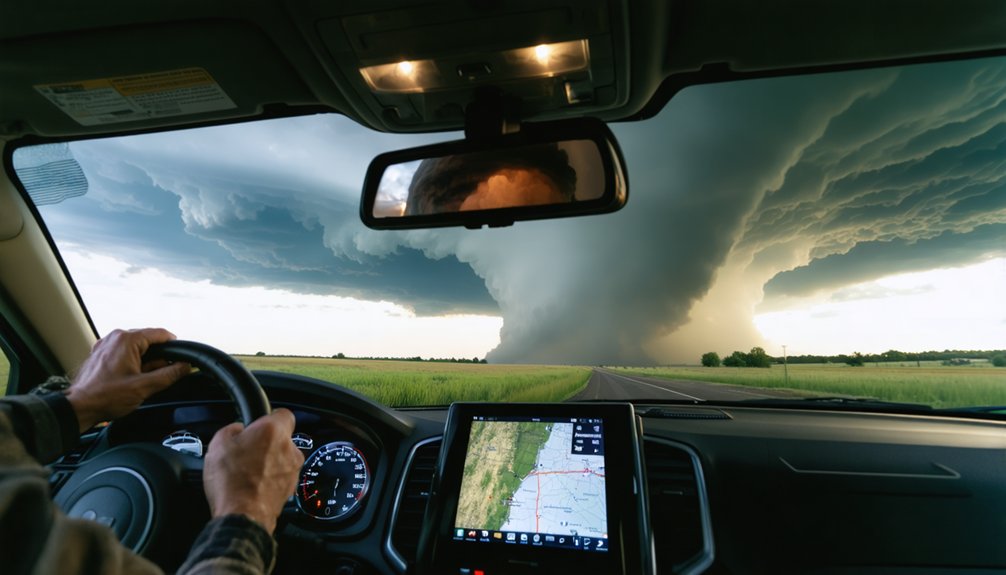
Real-Time Reporting Helps Save Lives Through Faster Warning Systems
Storm chasers function as critical nodes in the severe weather warning infrastructure, transmitting ground-truth data that fundamentally accelerates National Weather Service response protocols. Your access to real-time observations—hail diameter measurements, wind velocity confirmations, tornado genesis verification—bridges the gap between Doppler radar indications and actual surface conditions.
This immediate intelligence enables meteorologists to upgrade warnings from severe thunderstorm to tornado-possible status without bureaucratic delay. Early warning systems gain precious lead time through proactive spotter deployment during watch conditions, positioning observers before convective development.
You’ll find chaser live streams providing dashboard-mounted tornado documentation that validates radar signatures instantaneously. Amateur radio networks guarantee communication redundancy when conventional systems fail.
This decentralized reporting architecture enhances disaster relief coordination by verifying damage paths and directing emergency response resources to confirmed impact zones rather than theoretical threat areas.
New Technologies Are Transforming How Chasers Track and Document Storms
Revolutionary advancements in forecasting precision have equipped storm chasers with tools that fundamentally redefine severe weather intercept capabilities. Brian Ohm’s Date, Time, and Location forecasting methodology, validated by NOAA since 2022, now integrates with proprietary localization mapping technology deployed by Wild Weather Service for 2026’s tornado season. You’re witnessing unprecedented accuracy supplementing Storm Prediction Center’s Conditional Intensity Groups.
MyRadar’s level three radar product delivers critical processing speed improvements alongside dual pane modes supporting geocol satellite integration. Storm Ranger vehicles feature 360° camera durability enhancements, while compact hurricane remotes capture nine hours of stabilized 4K footage in surge conditions.
These technical capabilities enable livestream monetization models that’ve transformed revenue generation for independent chasers:
- Real-time storm documentation through refined streaming platforms
- Footage brokering to networks via specialized agencies
- Multi-role meteorological data collection during active intercepts
You’ll need substantial equipment investment for professional-grade operations.
Economic and Human Costs Are Rising as Tornadoes Strike Denser Populations
As tornado activity shifts eastward from traditional Great Plains corridors, you’re observing concentrated outbreak patterns that intersect with America’s most densely populated regions. Mississippi, Alabama, Arkansas, Missouri, Illinois, Indiana, Tennessee, and Kentucky show significant upward frequency trends, directly correlating with elevated disaster costs as urbanization accelerates across Dixie Alley.
You’ll notice tornado clustering onto fewer, more active days intensifies concentrated financial losses—economic damages manifest from greater societal wealth positioned in harm’s way. Growing human vulnerability emerges from outbreak dynamics: stronger tornadoes striking populated zones simultaneously endanger larger groups during single-day events.
While normalized damages per economic growth show reversals, absolute costs escalate. Population booms throughout the Southeast and Midwest compound your exposure risks, as denser development patterns place more assets and lives within volatile tornado paths.
Frequently Asked Questions
How Does Climate Change Affect the Formation Process of Individual Tornadoes?
Climate change alters your tornado formation through competing factors: you’ll see increased atmospheric instability boosting CAPE levels, potentially driving increased tornado intensity, while simultaneously experiencing reduced wind shear, creating uncertain changing storm dynamics that complicate prediction models.
What Specific Training Do Storm Chasers Receive for Data Collection Purposes?
You’ll master mobile mesonet methodology through SKYWARN’s exhaustive convective training, learning data collection techniques like probe deployment and atmospheric measurement. Weather monitoring protocols include radar interpretation fundamentals, standardized reporting structures, and real-time transmission systems for scientifically precise field observations.
Are Insurance Rates Increasing in Newly Affected Tornado-Prone Regions?
Yes, you’ll find insurance rates rising in newly tornado-affected areas through granular risk-scoring models. Insurers now emphasize homeowner preparedness strategies and community disaster response plans when calculating premiums, using AI-driven assessments to determine property-specific vulnerability factors.
How Do Storm Chasers Coordinate With Emergency Management During Active Chases?
Like spotters feeding radar data, you’ll relay real-time communication via ham radio to Net Control Stations, enhancing situational awareness. Your reports integrate with Doppler analysis, enabling meteorologists and emergency managers to issue precise warnings before tornadoes strike communities.
What Percentage of Tornado Outbreaks Now Occur Outside Traditional Tornado Alley?
Specific percentages aren’t provided, but you’ll notice geographic tornado distribution is shifting markedly. Seasonal tornado patterns show Dixie Alley’s increasingly hosting major outbreaks, while Mississippi Valley activity intensifies by April, altering traditional concentration metrics considerably.