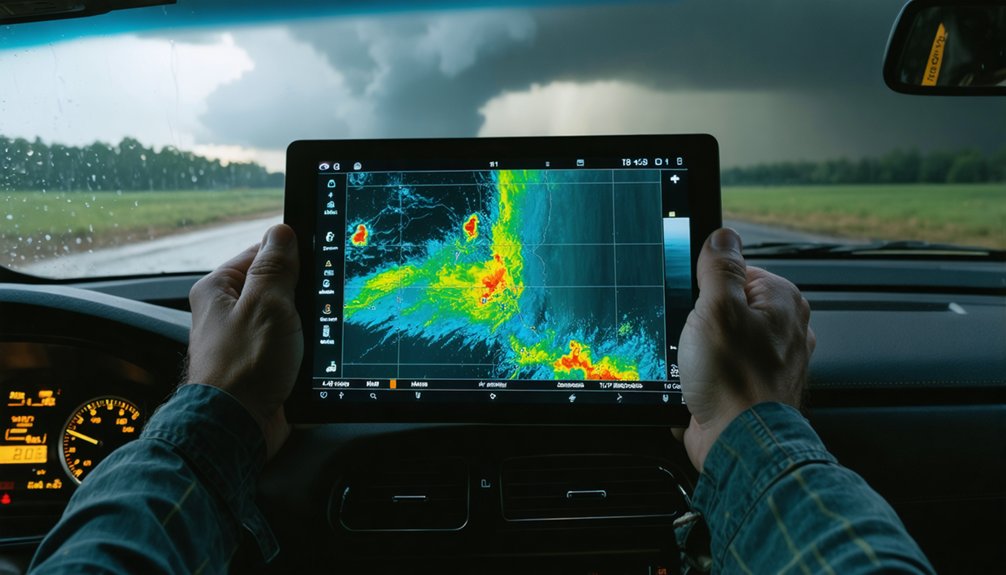
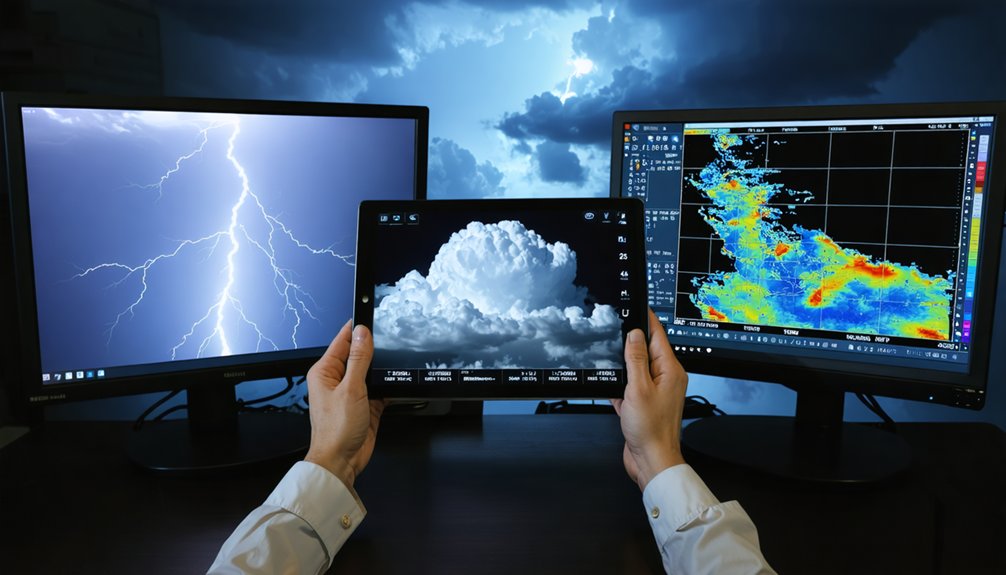
For accurate atmospheric condition monitoring, you’ll need a combination of specialized tools. Weather satellites give you wide-area coverage, while Doppler radar delivers real-time storm detection and wind velocity data. Anemometers measure local wind speed, barometers track pressure drops signaling approaching storms, and hygrometers paired with thermometers reveal humidity-temperature gradients. Mobile weather apps, air quality platforms, integrated environmental sensor systems, and industrial humidity sensors round out your toolkit—and each one offers far more capability than you’d expect.
Key Takeaways
- Weather satellites provide continuous remote sensing, delivering high-resolution imagery of cloud cover, storm systems, and temperature gradients over large regions.
- Doppler radar measures precipitation intensity and wind velocity, detecting rotating storm cells and wind shear patterns signaling tornado development.
- Anemometers measure wind speed and direction continuously, supporting aviation, marine, storm-chasing, and forecasting applications with enhanced situational awareness.
- Barometers track atmospheric pressure trends, with rapid pressure drops often preceding storms, improving short-term forecast accuracy when combined with radar data.
- Mobile weather apps aggregate satellite imagery, Doppler radar, and sensor data, offering custom alerts for pressure drops, precipitation, or lightning proximity.
Weather Satellites for Wide-Area Atmospheric Monitoring
Weather satellites form the backbone of wide-area atmospheric monitoring, delivering continuous remote sensing across vast land and ocean regions that ground-based instruments can’t efficiently cover. You’ll rely on these systems to capture high-resolution imagery of cloud cover, storm systems, and temperature gradients at scales no surface network can match.
Satellite calibration guarantees your sensor data remains accurate over time, correcting for instrument drift and atmospheric interference that would otherwise degrade forecast quality.
When you integrate satellite outputs with radar, buoy, and station data, data integration becomes your strongest asset, feeding large-scale weather models with diverse atmospheric inputs. This multi-source fusion sharpens forecast accuracy and extends your situational awareness across regional and global scales, giving you precise, actionable intelligence for severe weather tracking and long-range atmospheric analysis.
Doppler Radar for Real-Time Storm Detection and Wind Analysis
When you use Doppler radar, you’re leveraging the Doppler effect to measure frequency shifts in returned microwave pulses. This allows the system to calculate precipitation intensity and radial wind velocity in near real time.
You can detect rotating storm cells, track mesocyclones, and identify wind shear patterns that signal tornado development before it occurs.
These wind analysis capabilities give you precise, localized atmospheric data that directly supports severe weather warnings and short-term forecast accuracy.
How Doppler Radar Works
How does Doppler radar detect a storm’s internal wind structure from miles away? It transmits microwave pulses toward precipitation targets, then measures the frequency shift in returning signals.
When particles move toward the radar, the frequency increases; when they move away, it decreases. This shift, called the Doppler effect, reveals precise wind velocities inside storm systems.
You get real-time data on rotation, wind shear, and turbulence without deploying ground sensors into hazardous zones. The system also tracks aerosol disp
Storm Detection Capabilities
Doppler radar’s storm detection capabilities extend well beyond basic precipitation mapping. You can use it to identify wind shear, a critical indicator of developing severe weather, by analyzing velocity differentials across storm layers. These differentials reveal rotating updrafts that signal tornado formation before touchdown occurs.
Doppler systems also track cloud formation dynamics, letting you monitor how convective cells evolve in real time. Dual-polarization technology adds another layer of precision, distinguishing rain, hail, and snow based on signal return characteristics.
You’re not limited to regional data either — networked radar arrays give you continuous coverage across large geographic zones. This integration of velocity, reflectivity, and polarimetric data allows you to make confident, time-sensitive decisions during rapidly evolving severe weather events.
Wind Analysis Applications
Beyond
Anemometers for Precise Local Wind Speed Measurement
When precise local wind data matters, anemometers are your go-to ground-level instrument. They measure wind speed and direction continuously, giving you actionable atmospheric data at the station level.
Regular anemometer calibration ensures your readings stay accurate under field conditions, especially when tracking wind turbulence during rapid weather shifts.
Here’s what anemometers deliver:
- Real-time wind speed data at ground-level resolution
- Wind turbulence detection for identifying dangerous gust patterns
- Directional wind data when paired with vane-equipped models
- Integration capability with broader weather station logging systems
You’ll find them critical across aviation, marine, storm-chasing, and forecasting applications. When combined with barometric and radar data, anemometer readings sharpen your situational awareness and improve short-term forecast precision considerably.
Barometers for Atmospheric Pressure Tracking and Storm Prediction
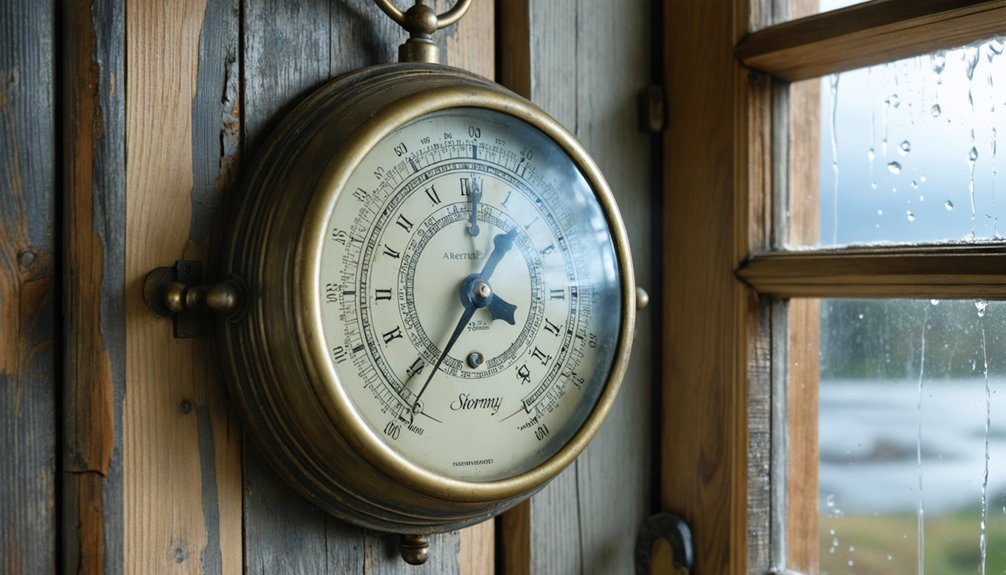
Atmospheric pressure is one of the most reliable indicators of incoming weather change, and barometers give you direct access to that data at the ground level. By tracking pressure trends, you can identify approaching low-pressure systems before they escalate into severe conditions.
A rapid pressure drop often precedes storm surge events, giving you critical lead time to act. Modern digital barometers log continuous readings, letting you analyze atmospheric tides—the subtle, cyclical pressure oscillations driven by solar and lunar forces.
Mercury, aneroid, and digital formats each serve distinct operational needs, from fixed station monitoring to portable field deployment. When you integrate barometric data with wind speed and radar inputs, your short-term forecasting accuracy improves markedly, and your decision-making stays grounded in real atmospheric conditions.
Hygrometers and Thermometers for Temperature and Humidity Monitoring
When you use a hygrometer, you’re measuring relative humidity through capacitive or resistive sensors that detect moisture-induced changes in electrical properties.
Pairing that data with thermometer readings gives you a clearer picture of atmospheric stability, dewpoint, and potential for cloud formation.
Together, temperature and humidity measurements sharpen your forecast accuracy by quantifying the moisture energy available to drive storm development and precipitation.
How Hygrometers Work
How does a hygrometer actually measure something as invisible as moisture in the air? It detects humidity through physical or electrical changes triggered by water vapor absorption. Here’s how the process works:
- Capacitive sensors measure dielectric changes in a polymer film as it absorbs moisture.
- Resistive sensors track electrical resistance shifts caused by humidity fluctuations.
- Humidity calibration ensures readings remain accurate against known reference conditions, preventing drift over time.
- Sensor integration links hygrometer outputs to broader environmental monitoring systems, enabling real-time data logging and alerts.
You get precise relative humidity readings—typically expressed as a percentage—that reflect actual atmospheric moisture levels. Accurate humidity calibration and seamless sensor integration let you maintain reliable atmospheric data without guesswork or costly measurement errors.
Temperature Monitoring Benefits
Pairing humidity data with accurate temperature readings gives you a complete picture of atmospheric conditions that neither measurement alone can provide. You’ll capture how solar radiation affects surface heating, thermal gradients, and convective instability—variables that directly shape forecast accuracy.
Temperature data also refines aerosol measurement interpretation, since particulate behavior shifts with thermal layers and moisture content. Modern thermometers deliver resolution down to ±0.1°C, letting you detect subtle atmospheric changes before they develop into significant weather events.
You’re not just logging numbers—you’re building a dynamic dataset that supports storm prediction, air quality analysis, and environmental compliance. Integrating continuous
Forecasting With Combined Data
Combining humidity and temperature data lets you move beyond isolated measurements into integrated atmospheric analysis that strengthens forecast precision. Cross-referencing both variables sharpens model accuracy across multiple forecasting layers:
- Stability indexing — Temperature-humidity gradients reveal atmospheric instability thresholds tied to convective storm development.
- Cloud microphysics modeling — Moisture and thermal profiles determine droplet formation rates, ice nucleation, and precipitation efficiency.
- Aerosol optical depth correlation — Humidity levels directly influence aerosol optical properties, affecting radiative transfer calculations in forecast models.
- Boundary layer analysis — Combined surface readings define mixing height and moisture flux, critical inputs for mesoscale prediction systems.
You gain sharper situational control when these datasets feed continuously into your monitoring
Rain Gauges and Lightning Detectors for Severe Weather Monitoring
When severe weather strikes, rain gauges and lightning detectors give you two critical data streams for real-time hazard assessment. Rain gauges deliver precise precipitation totals, letting you quantify storm intensity and evaluate flood risk across drainage systems and watersheds.
Tipping-bucket models log incremental rainfall at defined intervals, giving you timestamped accumulation records for hydrological analysis.
Lightning detectors complement this by tracking electrical discharge frequency, intensity, and proximity. You can integrate detection data with severe weather alerts to trigger site-specific safety protocols before conditions escalate.
Lightning safety decisions become data-driven rather than reactive when you’re monitoring strike rates and movement vectors in real time.
Together, these instruments expand your situational awareness during active storm events, supporting faster emergency response and reducing exposure risk for personnel and assets.
Mobile Weather Apps for On-Demand Atmospheric Data
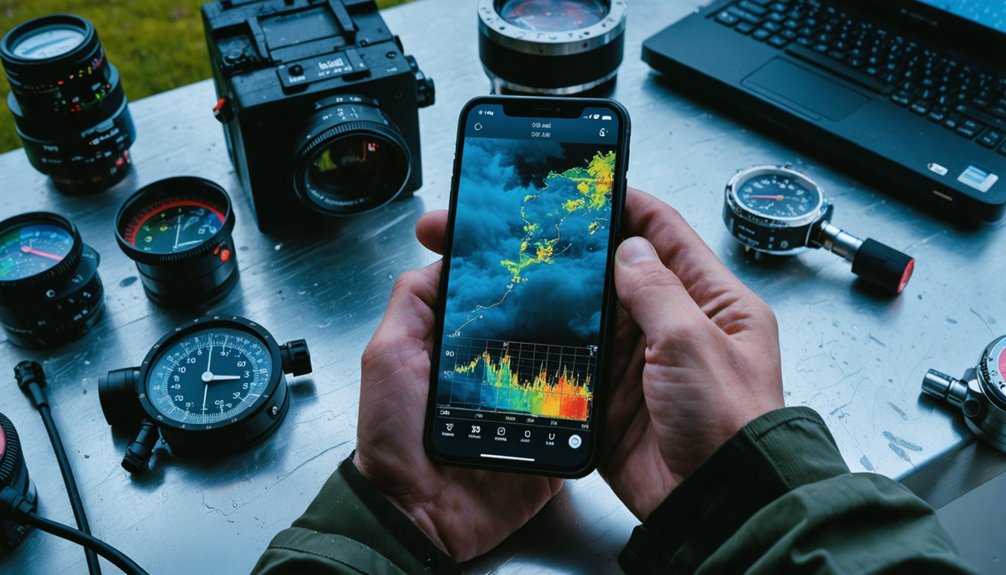
Ground-level instruments like rain gauges and lightning detectors capture localized storm data effectively, but mobile weather apps pull from a much broader atmospheric intelligence network—aggregating satellite imagery, Doppler radar feeds, surface station readings, and sensor arrays into a single interface you can access anywhere.
These apps give you independent, real-time atmospheric intelligence:
- Storm tracking – Monitor rotating cells and severe weather trajectories as they develop.
- Urban heat mapping – Identify temperature anomalies across city zones affecting local conditions.
- Air circulation analysis – Track wind flow patterns influencing regional atmospheric shifts.
- Custom alerts – Set threshold-based notifications for pressure drops, precipitation, or lightning proximity.
You’re not dependent on a fixed station—you’re carrying a deployable atmospheric monitoring system in your pocket.
Top Air Quality Monitoring Platforms for Real-Time Tracking
When you need real-time air quality data, platforms like Aeroqual Series 200, Aeroqual Cloud, PurpleAir, and Kaiterra give you precise pollutant and particulate tracking through cloud-based dashboards, configurable alerts, and API integrations.
You’ll find that each platform supports key monitoring features—including analytics, compliance reporting, and sensor management—that make continuous atmospheric assessment actionable across multiple environments.
Whether you’re managing industrial emissions, urban air quality, or workplace exposure limits, these tools let you match monitoring capabilities directly to your operational and regulatory requirements.
Leading Real-Time Platforms
As air quality concerns grow across industrial, urban, and environmental sectors, several platforms have emerged as leading solutions for real-time atmospheric pollutant tracking. These tools integrate satellite data and atmospheric modeling to deliver actionable environmental intelligence.
Key platforms you should consider include:
- Aeroqual Series 200 – Provides precise gas and particulate sensing with configurable sensor modules for industrial monitoring.
- Aeroqual Cloud – Delivers cloud-based data management, analytics dashboards, and compliance reporting.
- PurpleAir – Deploys low-cost sensors across distributed networks, enabling community-scale air quality mapping.
- Kaiterra – Combines indoor and outdoor monitoring with API integrations for scalable environmental oversight.
Each platform supports real-time alerts and data visualization, giving you independent control over your atmospheric monitoring strategy.
Key Monitoring Features
Each of the four leading platforms delivers a distinct set of monitoring features that directly shape how you collect, manage, and act on atmospheric data. Aeroqual Series 200 gives you real-time sensor output with configurable gas-specific modules, letting you adapt quickly to shifting atmospheric chemistry demands.
Aeroqual Cloud centralizes your data streams, supports historical climate analysis, and generates compliance-ready reports without manual extraction.
PurpleAir delivers crowdsourced particulate data across dense sensor networks, giving you granular spatial resolution at low cost.
Kaiterra combines PM2.5, CO₂, VOC, temperature, and humidity tracking into unified dashboards with API access for custom integrations.
Across all four, you get alert thresholds, trend visualization, and exportable datasets—core capabilities that keep your monitoring operation precise, autonomous, and audit-ready.
Industrial And Environmental Applications
Whether you’re managing industrial emissions or tracking urban air quality, the four platforms map directly onto real-world deployment scenarios with distinct operational advantages.
- Aeroqual Series 200 – Delivers precise pollutant dispersion data across fixed industrial sites, supporting compliance reporting.
- Aeroqual Cloud – Aggregates multi-sensor inputs remotely, letting you monitor urban heat gradients and emission trends through centralized dashboards.
- PurpleAir – Deploys low-cost distributed sensors across urban environments, giving you real-time particulate mapping for community-level air quality decisions.
- Kaiterra – Targets indoor and outdoor environments simultaneously, integrating temperature, humidity, and pollutant dispersion metrics into actionable analytics.
Each platform serves a distinct operational layer—from facility-level compliance to city-wide atmospheric intelligence—giving you granular control over your monitoring infrastructure without unnecessary dependency on centralized systems.
Environmental Monitoring Systems That Combine Multiple Atmospheric Sensors
When you need thorough atmospheric insight, environmental monitoring systems consolidate multiple sensors—gases, particulates, temperature, humidity, and pressure—into a single, unified stack.
You’re not limited to air-based variables either; many platforms integrate soil moisture and solar radiation tracking, giving you a complete environmental picture across both atmospheric and ground-level conditions.
Beyond air quality, integrated platforms extend monitoring to soil moisture and solar radiation for full-spectrum environmental awareness.
These systems deliver real-time dashboards, configurable alert thresholds, and API integrations that let you act on data without delay.
You can deploy them across industrial, agricultural, and urban environments, adapting sensor ranges to match your specific operational demands.
Industrial Humidity Sensors for Facility Atmospheric Monitoring
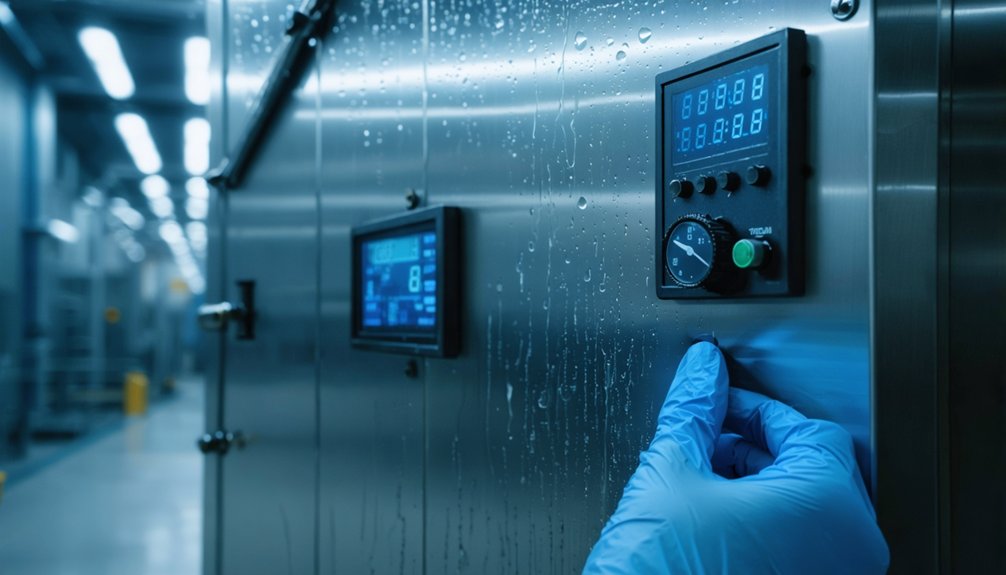
Industrial humidity sensors give you precise moisture tracking across production and processing environments where atmospheric conditions directly affect product quality, equipment performance, and regulatory compliance. You’ll gain actionable data that supports both predictive maintenance and compliance documentation.
Key capabilities to prioritize:
- Real-time relative humidity measurement across configurable ranges (0–100% RH) for zone-specific monitoring.
- Sensor calibration protocols that maintain measurement accuracy and reduce drift over extended operational cycles.
- Data integration with existing SCADA, PLC, or cloud-based platforms for centralized environmental oversight.
- Threshold alerting that triggers automated responses when humidity deviates from acceptable parameters.
These sensors give you independent control over your facility’s atmospheric conditions, reducing dependence on reactive interventions and keeping your operations within verified environmental specifications.
Frequently Asked Questions
How Much Does a Complete Atmospheric Monitoring System Typically Cost?
You’ll typically spend $500–$50,000+ depending on your sensor stack and scale. Factor in cost analysis across equipment lifespan—professional-grade systems average 7–10 years—to maximize your investment’s long-term data-driven value and operational freedom.
Which Atmospheric Monitoring Tools Are Best Suited for Beginner Use?
You’ll find mobile weather apps and basic barometers ideal for beginner use—they’re intuitive, require minimal sensor calibration, and deliver reliable air quality and atmospheric data, empowering you to monitor conditions independently without complex setup or technical expertise.
Can Atmospheric Monitoring Tools Be Integrated With Smart Home Systems?
Yes, you can integrate atmospheric monitoring tools with smart home systems. Many sensors offer smart home integration and automation compatibility, letting you trigger actions based on real-time pressure, humidity, or air quality data streams.
How Often Should Atmospheric Monitoring Equipment Be Calibrated or Replaced?
You should calibrate atmospheric monitoring equipment annually, though high-use sensors may need quarterly checks. Equipment lifespan varies—replace sensors every 3–5 years. Maintaining proper calibration frequency guarantees your data stays accurate and your monitoring remains reliable.
Are There Government Grants Available for Purchasing Atmospheric Monitoring Equipment?
Yes, you can access government funding for atmospheric monitoring equipment. Check your grant eligibility through EPA, NOAA, and DOE programs, as they’re actively supporting air quality and environmental data infrastructure investments.
References
- https://www.machinecdn.com/blog/best-condition-monitoring-software-2026/
- https://www.advancedtech.com/blog/types-of-condition-monitoring/
- https://www.gartner.com/reviews/market/condition-monitoring-software
- https://uptimecm.com/top-10-industries-using-conditioning-monitoring/
- https://crazystormchasers.com/atmospheric-condition-monitoring-for-storm-chasers/
- https://www.bestdevops.com/top-10-environmental-monitoring-tools-in-2025-features-pros-cons-comparison/
- https://worldmetrics.org/best/air-quality-monitoring-software/
- https://zipdo.co/best/air-quality-monitoring-software/
- https://www.scmgalaxy.com/tutorials/top-10-environmental-monitoring-tools-in-2025-features-pros-cons-comparison/