The best automated storm data collection devices include StreamSondes, Tail Doppler Radar, NOAA X-POL Mobile Radar, HACH FL900 Flowmeters, RAWS Stations, and Campbell Scientific AWS systems. Each targets specific conditions — from hurricane eyewalls to remote fire-weather terrain. You’ll want to match sensor range, transmission reliability, and portability to your operational environment. Whether you’re chasing severe weather or monitoring flash floods, the right device transforms raw atmospheric chaos into actionable intelligence — and each option has more capability than you’d expect.
Key Takeaways
- StreamSondes deploy from hurricane hunter aircraft without parachutes, measuring pressure, temperature, humidity, and wind during descent for dense hurricane datasets.
- NOAA X-POL Mobile Radar drives directly into severe weather, providing dual-polarized detection of precipitation size and density with exceptional resolution.
- HACH FL900 Flowmeter automatically pushes stormwater data every five minutes, integrating with autosamplers and rain gauges for synchronized flood monitoring.
- Remote Automatic Weather Stations autonomously collect wind speed, temperature, and precipitation data in remote, fire-prone, and isolated terrains.
- Tail Doppler Radar, mounted on aircraft, constructs detailed three-dimensional storm models, pinpointing strongest winds and intense rainfall zones precisely.
StreamSondes Collect Hurricane Data Without Parachutes
StreamSondes are ultra-lightweight, biodegradable hurricane data collection instruments developed by Skyfora that deploy directly from P-3 hurricane hunter aircraft — no parachutes required.
Their compact design lets you deploy multiple sondes simultaneously, maximizing spatial coverage and strengthening data accuracy across the storm’s structure.
Each sonde measures pressure, temperature, humidity, and wind as it descends through the hurricane’s atmosphere. You get dense, high-resolution datasets that reveal critical dynamics influencing hurricane impact — information that traditional methods struggle to capture at scale.
Dense, high-resolution data from every descent — revealing the critical hurricane dynamics that traditional methods miss.
Operational deployment expanded considerably during the 2024 hurricane season, proving the system’s reliability under extreme conditions.
Because they’re biodegradable, you eliminate equipment retrieval concerns entirely.
StreamSondes give you a streamlined, efficient pathway to precise hurricane intelligence without the logistical constraints that limit conventional dropsonde systems.
Tail Doppler Radar Gives Storms a 3D CT Scan
When you mount a Tail Doppler Radar (TDR) at the rear of a P-3 or G-IV aircraft, it scans the storm continuously, capturing near-vertical cross-sections of precipitation and wind data with each pass.
The system stacks these cross-sections to construct a detailed three-dimensional image of the storm’s internal structure, much like a CT scan reveals anatomy.
From this 3D model, you can pinpoint the strongest winds, measure their extent from the storm’s center, and locate the most intense rainfall zones.
Mounted Radar Scans Continuously
Mounted at the rear of NOAA’s P-3 and G-IV aircraft, the Tail Doppler Radar (TDR) continuously scans storms as the plane flies through them, capturing near-vertical cross-sections of precipitation and wind data in real time.
Each pass builds upon the last, constructing a three-dimensional image of the storm’s interior. You’re fundamentally watching storm dynamics unfold as the radar identifies the strongest winds, measures their extent from the storm’s center, and pinpoints intense rainfall regions.
The system’s continuous scanning eliminates data gaps that’d otherwise compromise your situational awareness. By stacking cross-sections into a full 3D model, you gain a CT scan-like view of the storm’s structure, enabling precise analysis of how the system’s evolving before it makes landfall.
Building 3D Storm Images
As the Tail Doppler Radar stacks each near-vertical cross-section captured during successive passes, it assembles a detailed three-dimensional model of the storm’s interior.
This 3D modeling process integrates continuous wind and precipitation data into a cohesive storm visualization you can analyze with precision.
Through data integration across multiple flight passes, you gain a sensor fusion output that reveals wind field structure, rainfall intensity zones, and rotational dynamics simultaneously.
Imagery analysis of the compiled dataset supports atmospheric dynamics assessment, letting you identify where the strongest winds originate and how far they extend from the storm’s center.
Precipitation mapping pinpoints intense rainfall concentrations, while the complete volumetric picture enables accurate storm classification.
You’re fundamentally commanding a CAT scan of a live hurricane, yielding actionable intelligence that no single-point sensor can match.
Identifying Strongest Wind Locations
Once the three-dimensional storm model is assembled, the Tail Doppler Radar‘s real analytical value emerges in pinpointing where the strongest winds actually live within the storm structure.
You’re no longer guessing—you’re working with precise, actionable intelligence.
The TDR delivers critical wind data you can act on immediately:
- Wind speed mapping identifies the exact zones where destructive forces concentrate
- Wind direction analysis reveals rotational patterns and asymmetries threatening coastal or inland targets
- Wind extent measurements define how far dangerous conditions radiate outward from the storm’s center
This capability lets forecasters issue tighter, more reliable warnings.
Instead of broad uncertainty zones, you get defined threat corridors.
That precision directly protects communities, infrastructure, and the people who choose where to shelter or evacuate before a storm makes landfall.
NOAA X-POL Mobile Radar Chases Storms to the Source
When severe weather strikes, the NOAA X-POL Mobile Radar doesn’t wait for data to come to it—it drives directly into position to scan the low-level atmosphere where storms develop.
This dual-polarized X-Band system redefines storm chasing by putting advanced radar technologies exactly where you need them most.
You gain precise detection of tiny water droplets, snowflakes, and individual cloud particle shapes. The system measures precipitation size and density with exceptional resolution, giving you actionable data across tornadoes, hurricanes, dust storms, and winter weather events.
Unlike fixed radar installations, the X-POL’s mobility lets you position it strategically, capturing low-level atmospheric data that stationary systems simply can’t access.
You’re not waiting for weather to reach a sensor—you’re taking the sensor directly to the weather.
HACH FL900 Flowmeters Catch Flooding Before It Peaks
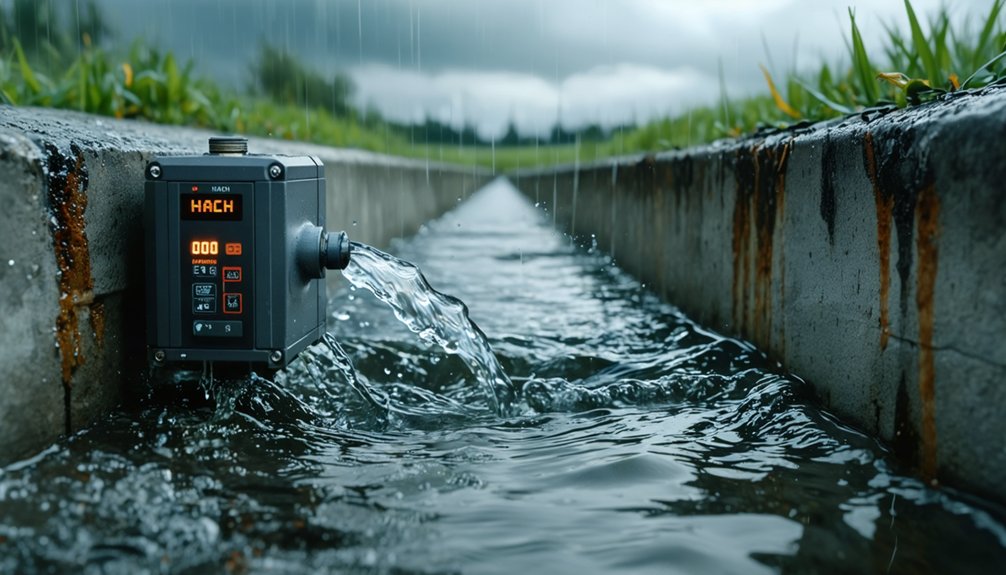
Flooding doesn’t announce itself with enough warning—but the HACH FL900 Flowmeter gives you a critical edge by pushing stormwater data automatically every five minutes directly to the web.
For flood monitoring, that near-real-time stream means you’re never flying blind when conditions escalate fast.
The FL900 integrates seamlessly with:
- Autosamplers and rain gauges for synchronized, flow-weighted sampling triggered by volume thresholds
- Solar panels keeping your station independent from grid infrastructure
- Alarm systems alerting field crews instantly when equipment failures compromise data accuracy
You get real-time flow hydrographs, station status, and complete sample history without manual retrieval.
The FL900 doesn’t just collect data—it positions you to act decisively before flood conditions peak, protecting infrastructure and keeping your monitoring operation fully autonomous.
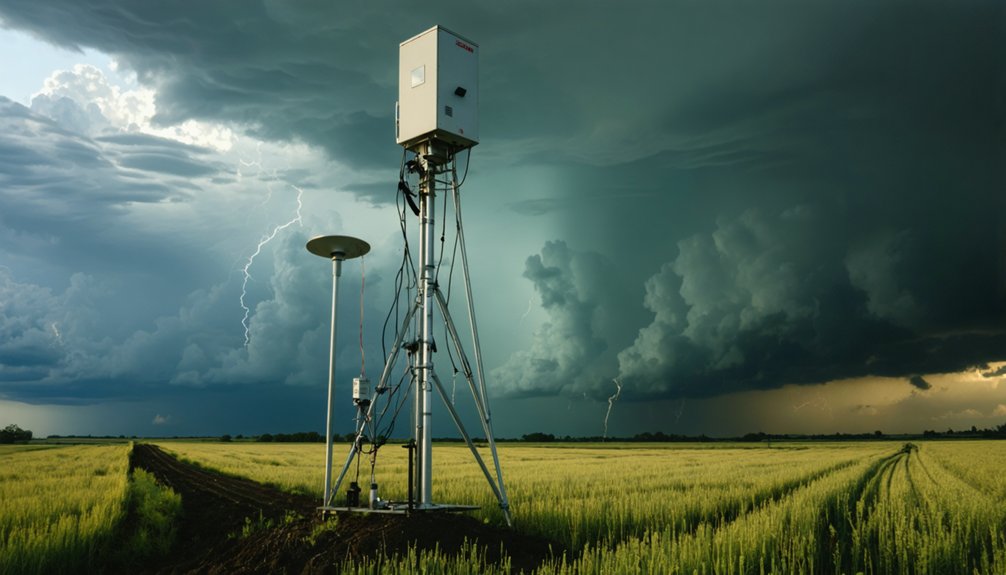
RAWS Stations Automate Weather Monitoring Anywhere Signal Can’t Reach
Remote Automatic Weather Stations (RAWS) solve a fundamental monitoring problem: how do you collect reliable weather data where infrastructure doesn’t exist? You deploy RAWS stations, and they handle the rest autonomously.
Each unit measures wind speed, direction, air temperature, precipitation, relative humidity, solar radiation, and fuel moisture without requiring human presence. That capability makes them essential tools for remote monitoring across wilderness zones, fire-prone landscapes, and isolated terrain where cellular networks simply don’t reach.
RAWS stations support fire weather forecasting and resource management by automating data collection continuously. They contribute directly to environmental resilience by capturing conditions that would otherwise go unrecorded, giving emergency responders and forecasters the situational awareness they need to make faster, better-informed decisions when severe weather or wildfire threatens.
Campbell Scientific AWS Sensors Cover Air, Soil, and Precipitation in One System
When you deploy Campbell Scientific AWS sensors, you gain access to a fully integrated system that measures air temperature, flux, precipitation, visibility, and soil moisture simultaneously.
You can transmit that data via cellular, Wi-Fi, or Ethernet, giving you reliable connectivity even in challenging field conditions.
Heated precipitation sensors extend your system’s capability to detect snow, while soil moisture sensors deliver volumetric water content and temperature data in a single package.
Comprehensive Environmental Sensing Capabilities
Campbell Scientific’s AWS sensors give you a single, integrated platform that monitors air, soil, and precipitation conditions simultaneously.
You’re not piecing together incompatible systems—you’re deploying coordinated environmental monitoring hardware that feeds into unified data integration workflows.
The sensor suite covers three critical measurement categories:
- Atmospheric parameters: air temperature, flux, and visibility sensors capture real-time conditions above ground
- Precipitation detection: standard rain gauges and heated models measure liquid and frozen precipitation accurately
- Soil analytics: volumetric water content and temperature sensors track subsurface conditions continuously
Your data logger acts as the central hub, collecting and transmitting measurements via cellular, Wi-Fi, or Ethernet.
This architecture lets you maintain full situational awareness across multiple environmental variables without managing fragmented systems or unreliable data streams.
Flexible Data Transmission Options
Whether you’re deploying sensors in a remote field site or an urban monitoring station, the Campbell Scientific data logger transmits collected measurements through cellular, Wi-Fi, or Ethernet connections—giving you direct control over how data reaches your central systems.
This flexibility in data transmission means you’re never locked into a single communication infrastructure. The system’s sensor integration capabilities let you combine air temperature, precipitation, flux, and soil moisture sensors under one unified logger, eliminating the need for multiple independent platforms.
You choose which sensors to connect, which transmission pathway to activate, and how frequently data pushes to your network. Heated precipitation sensors extend functionality into winter conditions, while soil moisture sensors deliver volumetric water content alongside temperature readings—keeping your monitoring operation adaptable, scalable, and entirely responsive to your specific operational requirements.
Which Storm Data Collection Device Fits Your Operation?
Choosing the right storm data collection device depends on your operational environment, data requirements, and deployment constraints. Match each tool to your mission by evaluating storm data accuracy, portability, and device compatibility with existing infrastructure.
Consider these key operational factors:
- Airborne hurricane tracking — Deploy StreamSondes or leverage TDR for real-time three-dimensional wind and precipitation mapping.
- Ground-level stormwater or fire weather monitoring — Use HACH FL900 Flowmeters or RAWS for automated, remote data collection.
- Mobile or rapid-response observation — Position NOAA X-POL radar quickly to capture low-level atmospheric conditions during tornadoes or winter storms.
Your environment dictates your equipment.
Prioritize sensor range, transmission reliability, and scalability to guarantee your chosen device delivers actionable, precise storm intelligence independently.
Frequently Asked Questions
Can Multiple Storm Data Collection Devices Be Used Together Simultaneously?
Yes, you can deploy multiple devices simultaneously, ensuring data synchronization across platforms like TDR radar, StreamSondes, and flowmeters. Device compatibility lets you integrate diverse sensors, giving you extensive, precise storm analysis with complete operational freedom.
How Long Do These Automated Devices Typically Last in Extreme Conditions?
Like Odysseus weathering the storm, you’ll find durability factors vary widely—RAWS and Campbell sensors endure years outdoors, while StreamSondes are single-use. Your maintenance requirements directly determine longevity, keeping deployments reliable across extreme environmental conditions.
Are These Storm Monitoring Devices Suitable for Small-Scale Personal Use?
Some devices suit personal use well. Campbell Scientific’s AWS sensors and HACH FL900 flowmeters offer scalable storm monitoring you can deploy independently. However, TDR and StreamSondes require aircraft or specialized infrastructure, making them impractical for individual ownership.
What Training Is Required to Operate These Automated Storm Collection Systems?
Like a pilot mastering their cockpit, you’ll need sensor calibration expertise and data integration skills. You’d require meteorological training, software proficiency, and equipment-specific certification to independently operate these automated storm collection systems effectively.
How Much Do These Professional Storm Data Collection Devices Typically Cost?
You’ll find costs vary widely across these systems. StreamSondes and RAWS run thousands, while TDR and X-POL radar demand six-figure investments. Your cost analysis and budget considerations should prioritize mission-critical data needs before committing financially.
References
- https://metergroup.com/measurement-insights/weather-monitoring-system-comparison-which-is-right-for-you/
- https://www.aoml.noaa.gov/observational-instruments/
- https://www.campbellsci.com/blog/beginners-guide-automated-weather-stations-aws
- https://www.weathershack.com/blogs/news/comparing-professional-vs-home-weather-stations-which-is-right-for-you
- https://www.geoweeknews.com/storm-response-in-a-3d-world-how-lidar-and-pointerra3d-accelerate-utility-and-government-recovery
- https://www.nifc.gov/about-us/what-is-nifc/remote-automatic-weather-stations
- https://www.scsengineers.com/wp-content/uploads/2015/03/Porter_Advances-in-Stormwater-Monitoring_CE_News1.pdf
- https://www.frontiersin.org/journals/climate/articles/10.3389/fclim.2022.933543/full
- https://www.nssl.noaa.gov/news/video/field-equipment/