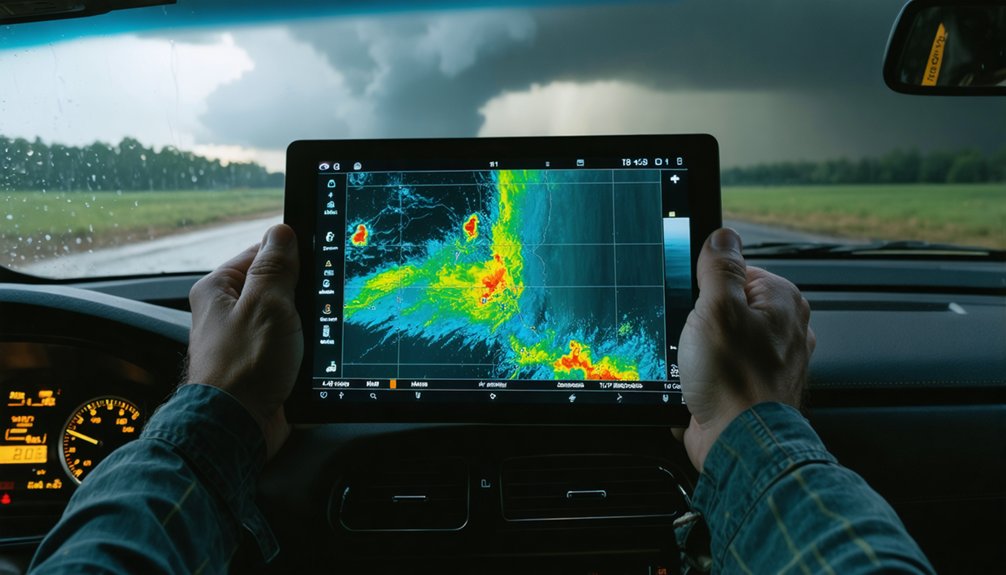
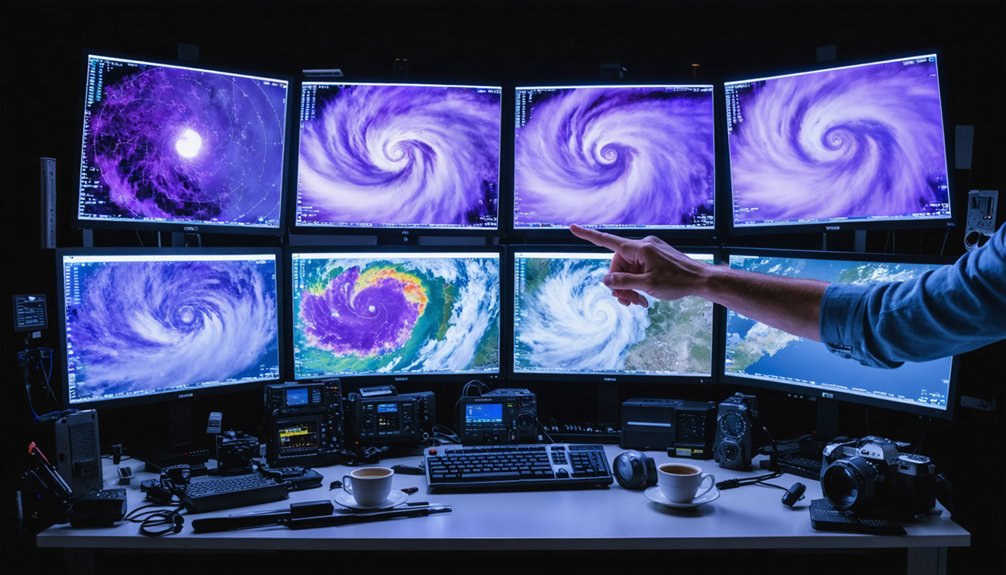
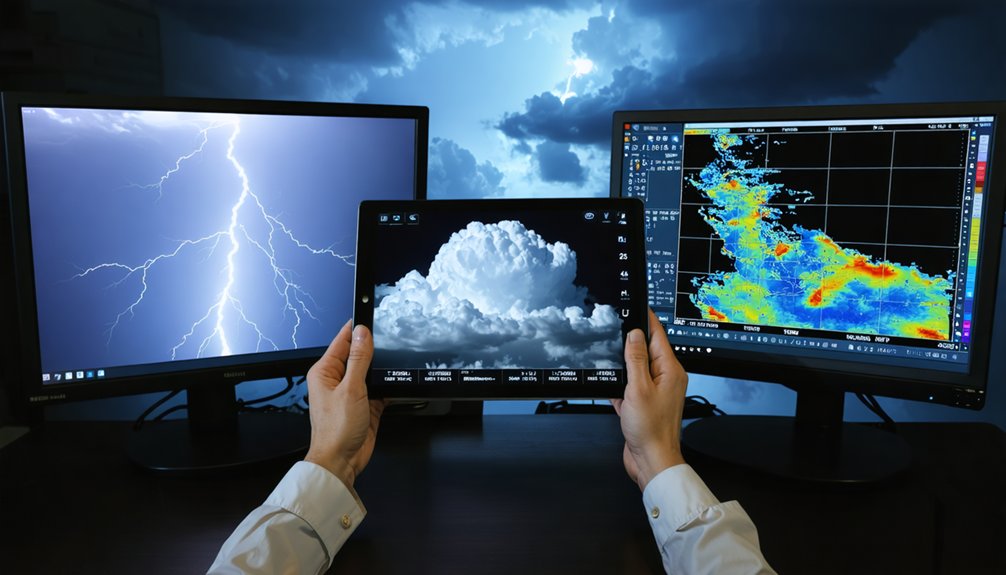
Improving your storm chasing success starts with layering multiple data streams rather than trusting a single source. Compare ensemble model outputs from GFS, NAM, and HRRR to narrow your target area and identify uncertainty. Use satellite imagery to catch early cumulus development before radar activates, then validate conditions with mobile sensors and surface observations. Integrate GPS-georeferenced data and radar velocity analysis to sharpen your situational awareness. Each technique covered ahead builds on this foundation.
Key Takeaways
- Comparing GFS, NAM, and HRRR model outputs simultaneously increases forecast confidence when predictions converge and highlights uncertainty when they diverge.
- Doppler velocity couplets and dual-polarization radar data enable early mesocyclone detection, improving tornado warning lead times significantly.
- Mobile sensor data synced with GPS timestamps provides real-time ground-truth verification, reducing reliance on delayed forecast models.
- Visible and infrared satellite imagery detects early cumulus growth and rapid cloud-top cooling before storms appear on radar.
- Neural networks trained on georeferenced radar datasets automate hook echo and debris signature detection faster than manual analysis.
Stop Relying on One Model: How Ensemble Forecasting Narrows Your Target
When you build a forecast around a single model run, you’re gambling your entire chase day on one solution that may shift dramatically by the next update.
Instead, compare GFS, NAM, and HRRR outputs simultaneously. Each model applies different data assimilation methods and model calibration parameters, producing distinct storm environment solutions.
Each model speaks a different dialect of the atmosphere—learn to read all of them at once.
Where outputs converge, confidence rises. Where they diverge, uncertainty flags a risk you can’t ignore.
Run ensemble comparisons at multiple initialization times to detect timing shifts in convective initiation, shear profiles, and moisture return.
Consistent agreement across models narrows your target zone and reduces wasted mileage.
Persistent disagreement tells you to hold positioning flexible.
Treating model spread as actionable data—not noise—gives you a measurable edge before you ever leave the driveway.
Read Satellite Imagery Before Radar Even Lights Up
Before radar paints a single echo, you can track early convective development by scanning visible satellite imagery for emerging cumulus fields and upward vertical growth.
You’ll want to monitor cloud-top temperatures on infrared channels, because rapid cooling signals strengthening updrafts that often precede detectable reflectivity.
These two techniques together give you a critical lead-time advantage, letting you reposition toward high-probability initiation zones before storms fully organize.
Spotting Early Cumulus Growth
Radar goes dark on early convective development, but visible satellite imagery doesn’t. You can track cloud formation well before reflectivity builds by watching cumulus fields organize, cluster, and push vertically. That upward growth signals atmospheric moisture converging with lift — a combination that precedes storm initiation by tens of minutes.
Watch for rapidly developing cumulus towers along drylines or boundary intersections. When tops sharpen and shadows lengthen, instability is overcoming the cap. That’s your cue to reposition before the chase becomes reactive.
Visible satellite gives you positional freedom — you’re reading the atmosphere on your terms, not waiting for radar confirmation. Identifying that early vertical development puts you ahead of the storm’s timeline, not behind it.
Tracking Cloud-Top Cooling
Infrared satellite channels let you read convective intensification before a single radar return appears. As updrafts strengthen, cloud tops rise into colder atmospheric layers, producing measurable cooling signatures on IR imagery. You’re watching temperature values drop rapidly across expanding cloud canopies—a direct indicator of vertical development accelerating beneath.
Cloud top analysis gives you timing leverage, letting you position ahead of storms rather than reacting to established radar signatures.
Track brightness temperature trends across consecutive IR frames. A sustained cooling rate exceeding roughly 5–10°C per 15-minute interval signals explosive growth. Pair that with your surface observation data and boundary placement, and you’ve got a convergent picture of where initiation is sharpening.
Don’t wait for radar confirmation—IR cooling signatures consistently precede it.
Map Surface Observations to Expose What Models Get Wrong
Surface observations cut through model error by anchoring your analysis in what’s actually happening at ground level. Models smooth over surface variability—they can’t capture every local boundary shift, moisture surge, or wind shift line that you’re able to see in real-time station data.
When you map observations against model output, discrepancies become visible. A dew point 8°F higher than forecast along a dryline changes your initiation target immediately.
Watch for observation gaps that create blind spots in your surface analysis. Sparse networks leave corridors where boundaries go undetected until convection fires. You can offset that by integrating mesonet data, mobile observations, and visible satellite to fill those voids.
Treat every surface discrepancy as actionable intelligence—models tell you what was expected; observations tell you what’s real.
Radar Techniques That Detect Rotation Before a Tornado Forms
Detecting rotation before a tornado forms gives you a critical time advantage, and Doppler radar velocity data is your primary tool for doing that. Velocity couplets reveal inbound and outbound wind shear across a tight azimuthal range, flagging mesocyclone development well before reflectivity shows a classic hook echo.
Prioritize low-level scans, since vortex detection near the surface carries far more warning value than mid-level rotation alone.
As storm structure matures, dual-polarization products sharpen your analysis. A tornadic debris signature—marked by high correlation coefficient drops collocated with strong rotation—confirms a damaging vortex on the ground without visual confirmation.
That distinction matters when rain-wrapped circulation blocks your view. Cross-referencing velocity data with debris signatures gives you the highest-confidence rotation assessment available from a radar display.
Plot Boundaries in GIS to Stay Positioned and Find Safe Exits
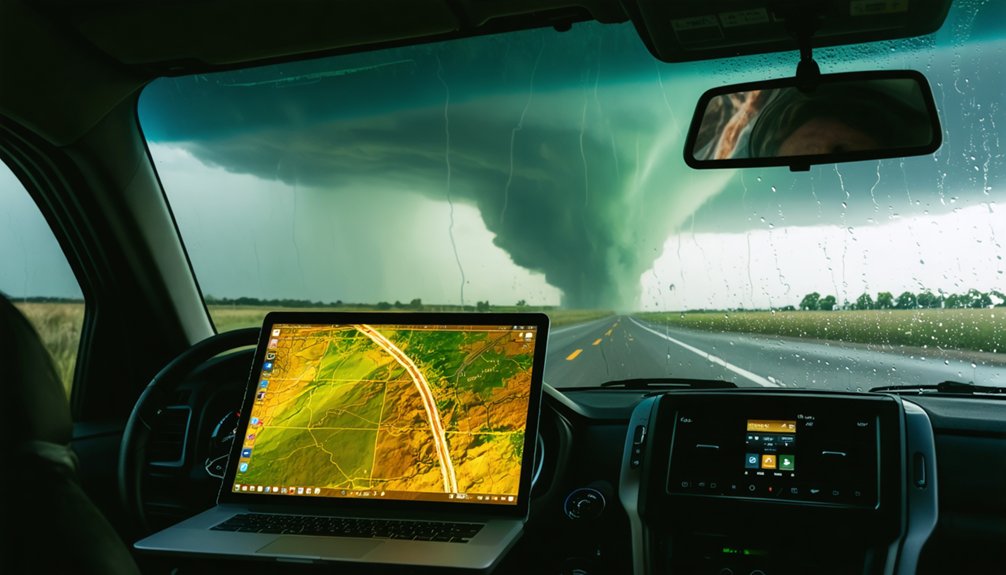
When you plot drylines, outflow boundaries, and warm fronts in a GIS environment, you gain a real-time spatial reference that keeps your positioning relative to storm initiation zones accurate and actionable.
Boundary intersection mapping lets you identify high-probability convergence points while simultaneously evaluating road networks for viable escape corridors. You should update these layers continuously as observed data supersedes model guidance, ensuring your exit routes account for storm motion and shifting boundary positions.
Mapping Boundaries for Positioning
Plotting boundaries in GIS gives you a structural framework for positioning decisions that raw radar and satellite imagery alone can’t provide. By layering drylines, warm fronts, and outflow boundaries onto a georeferenced map, you’re tracking boundary dynamics in spatial context rather than interpreting them abstractly.
That spatial clarity tells you where storm initiation is most probable and which road networks keep you mobile without committing to a dangerous position.
As boundaries shift, you update their plotted locations against current surface observations, letting you reposition before conditions deteriorate. You’re also identifying escape corridors in advance—routes that stay clear of projected storm tracks.
That preemptive mapping separates reactive driving from calculated movement, giving you the operational freedom to stay close to significant weather without sacrificing a safe exit.
Identifying Safe Escape Routes
How you plan your exits before initiating a chase determines whether you stay in position or get forced into reactive driving. Load your GIS platform with current boundary overlays—drylines, outflow boundaries, warm fronts—then plot your intercept corridor against road networks before convection fires.
Storm structure dictates how quickly your escape window closes, so you’ll need to anticipate motion vectors and identify perpendicular evacuation routes early. Weather symbolism on synoptic charts isn’t decorative; those frontal markers tell you where pressure gradients tighten and where driving conditions deteriorate fastest.
Use storm-position plotting to track your location relative to the mesocyclone’s projected path. If your primary exit aligns with storm motion, flag a secondary route immediately. Reactive driving kills chasers—proactive spatial analysis keeps you free to reposition safely.
Collect Mobile Sensor Data to Validate Conditions on the Ground
Mobile sensors mounted on your chase vehicle give you ground-truth data that radar and model guidance can’t provide on their own. You’re capturing real-time surface temperature, pressure, and wind measurements that validate or contradict what models predicted hours earlier. Sensor calibration matters here — uncalibrated instruments introduce errors that compromise your field readings and corrupt downstream analysis.
Data integration ties everything together. You’ll want your sensor output synced with GPS timestamps, radar scans, and visual observations so each data stream reinforces the others. When your surface pressure drops sharply and radar simultaneously shows tightening rotation, you’ve got convergent evidence — not isolated signals. That alignment sharpens your situational awareness and lets you make faster, more confident positioning decisions without depending solely on delayed model updates.
Use GPS Tracks and Georeferenced Imagery to Strengthen Storm Records
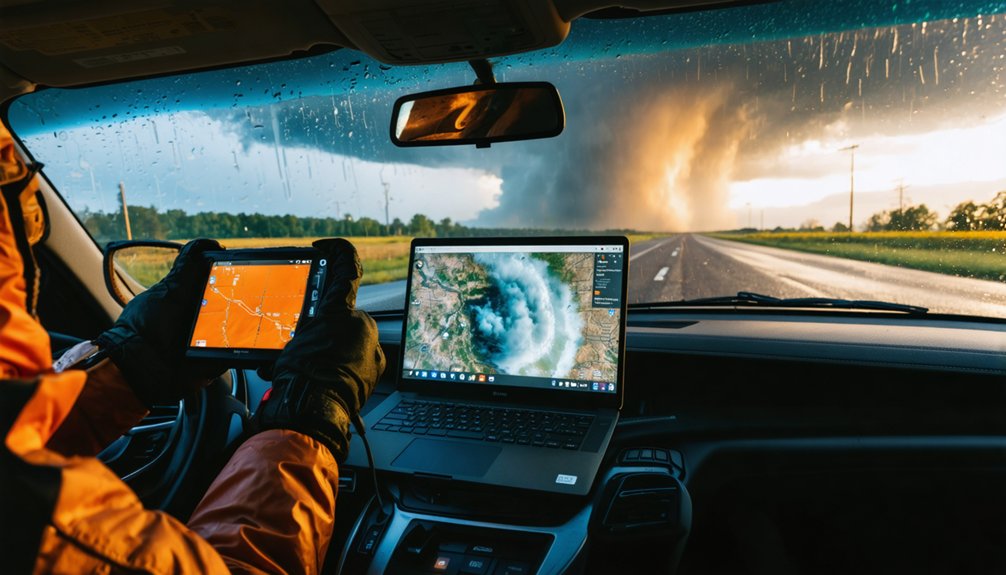
Every GPS track you record creates a spatial backbone for your storm data, letting you align chase imagery, radar scans, and sensor readings to exact geographic positions rather than relying on manual map estimates.
When you georeference your video and photos, imagery accuracy improves markedly—each frame ties directly to a verified coordinate, eliminating positional guesswork during post-analysis.
You can overlay georeferenced imagery onto GIS platforms to support storm boundary visualization, revealing how drylines, outflow boundaries, and damage paths relate spatially to your recorded position.
Archiving GPS tracks also lets you reconstruct your chase route against radar loops frame by frame, strengthening multi-source comparisons.
That precision compounds over time, building a reliable dataset that improves both your forecasting interpretation and your scientific contributions to storm research.
Apply Machine Learning to Recognize Tornadic Signatures Faster
Building a georeferenced archive gives you clean, time-stamped data—and that structured dataset becomes a strong foundation for machine learning workflows. Neural networks trained on radar velocity, reflectivity, and dual-polarization fields can isolate tornadic signatures faster than manual scanning allows. You’re no longer dependent on a single analyst’s pattern recognition under time pressure.
Feed your archived chase data into feature extraction pipelines that flag hook echoes, velocity couplets, and debris signatures automatically. Models trained on historical tornadic events learn to weight those features accurately, reducing detection lag during active storms.
As you accumulate more GPS-verified field reports alongside radar snapshots, your training dataset grows stronger. The result is a feedback loop where each chase sharpens the model’s ability to distinguish tornadic circulation from non-tornadic rotation with greater precision.
Frequently Asked Questions
How Does Statistical Weather Prediction Use Historical Data to Estimate Tornado Probability?
Like a compass guiding you through chaos, statistical weather prediction harnesses historical datasets, numerical modeling, and climate modeling — you’re revealing pattern recurrence and storm probability, freeing your forecasts from uncertainty with precise, data-driven tornado likelihood estimates.
How Does Time-Series Analysis Help Identify Timing Shifts in Storm Environments?
You’ll detect timing shifts by tracking temporal patterns across successive model runs and observation cycles. Data visualization lets you spot trends and anomalies early, so you’re adjusting your chase strategy before evolving storm environments outpace your original forecast.
Can Infrared Satellite Channels Alone Confirm Whether Convection Is Genuinely Strengthening?
Infrared analysis alone can’t fully confirm convection confirmation—you’ll see cooling tops, but you must cross-reference visible satellite, radar, and surface obs to verify genuine strengthening rather than misleading cirrus contamination or anvil spread.
How Does Camera-Clock Calibration Improve the Scientific Value of Storm Footage?
Like Einstein syncing clocks, camera calibration guarantees your footage accuracy by aligning storm imagery with radar and lightning timelines, letting you independently verify atmospheric events with precision that’s free from ambiguity or guesswork.
What Synoptic Patterns Are Most Strongly Associated With Elevated Tornado Potential?
You’ll find western troughing paired with southeastern ridging most strongly drives tornado potential. Track mesocyclone signatures where these patterns intersect, and confirm dewpoint thresholds support deep instability before committing to a target area.
References
- https://www.youtube.com/watch?v=6otZLjSZvPU&vl=en
- https://www.reddit.com/r/stormchasing/comments/1lu1i3n/next_august_im_going_stormchasing_can_i_have_some/
- https://www.preventionweb.net/news/what-do-storm-chasers-really-do-two-tornado-scientists-take-us-inside-chase-and-tools-studying
- https://www.stormchasingusa.com/blog/learning-the-basics-about-storm-chasing/
- https://stormtrack.org/threads/the-disparate-nature-of-storm-chasing-knowledge-how-do-we-fix.30976/
- https://crazystormchasers.com/advanced-techniques-for-storm-chasers-data-analysis/
- https://crazystormchasers.com/effective-techniques-for-storm-chaser-cell-monitoring/
- https://www.iheart.com/podcast/1333-storm-chaser-coaching-271967150/episode/why-observed-data-is-king-on-335724775/
- https://crazystormchasers.com/enhancing-weather-tracking-techniques-for-storm-chasers/
- https://journals.ametsoc.org/view/journals/bams/97/11/bams-d-15-00174.1.xml