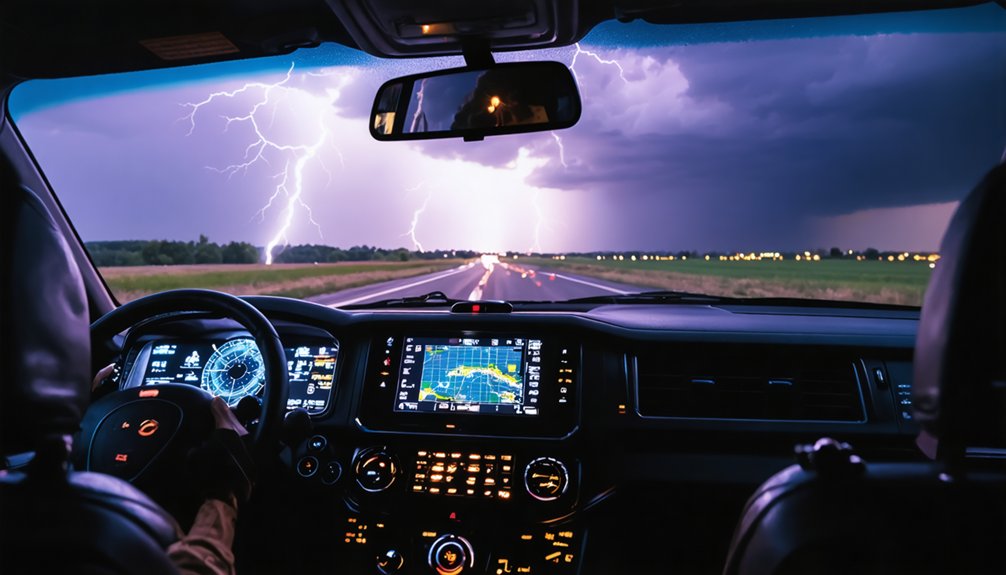
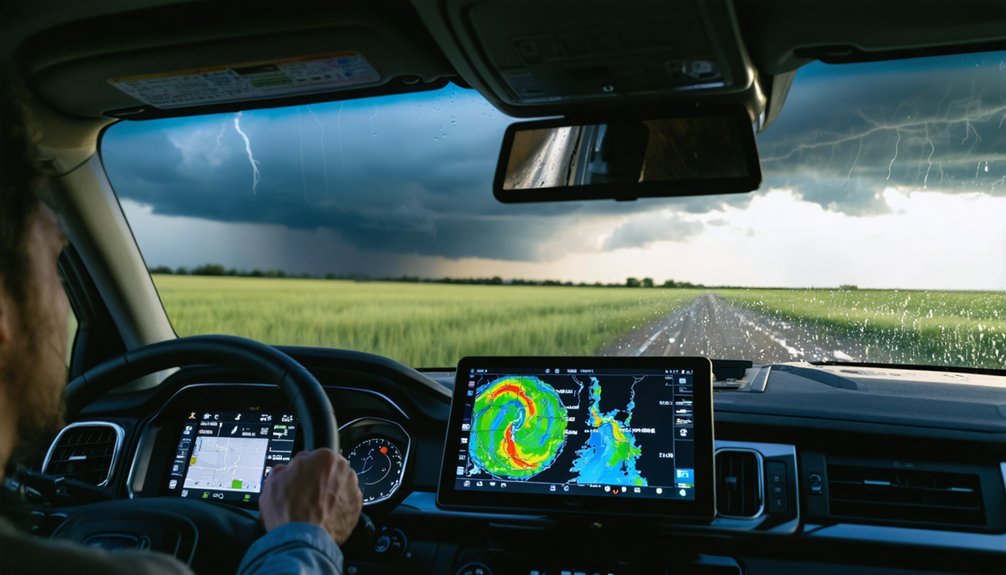
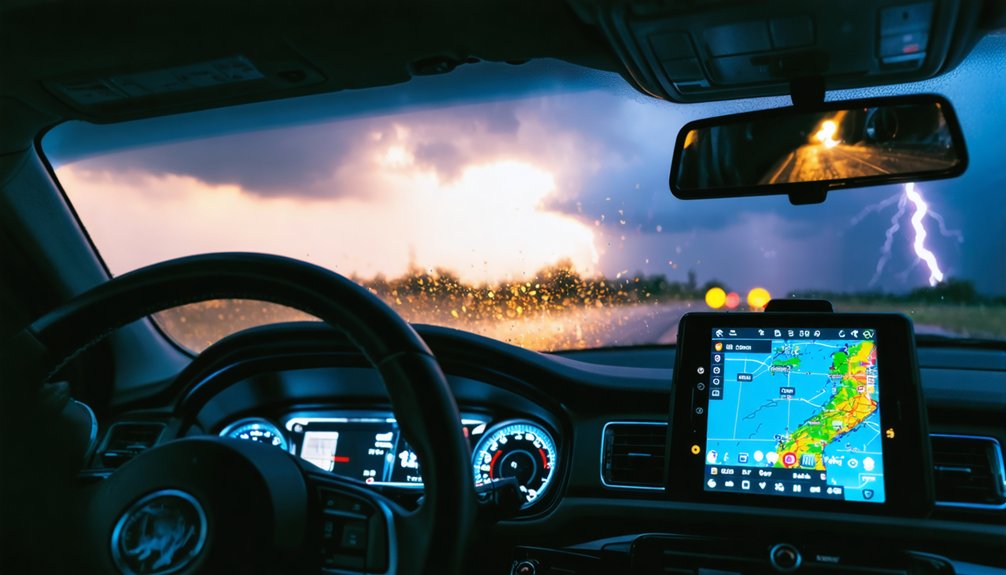
Remote sensing has redefined what you can know before a tornado touches down. You can track vegetation damage with NDVI analysis, confirm vortex rotation using dual-polarization radar’s correlation coefficient drops, and penetrate cloud cover with Synthetic Aperture Radar. Thermal infrared sensors reveal structural damage, while UAS and LiDAR capture centimeter-accurate surface data. AI-driven convolutional neural networks automate debris classification across massive datasets. Each technique open a precision layer that transforms how you pursue and analyze severe storms.
Key Takeaways
- Dual-polarization radar detects tornado debris through drops in correlation coefficient below 0.80, confirming vortex rotation without visual or spotter reports.
- SAR penetrates cloud cover and darkness, mapping surface deformation with millimeter-scale precision using InSAR during active storm conditions.
- NDVI analysis compares pre- and post-event satellite imagery to map tornado damage paths through dense or remote forested terrain.
- Convolutional neural networks automate debris detection across large post-storm imagery datasets, improving damage zone classification speed and accuracy.
- UAS and LiDAR generate centimeter-accurate 3D point clouds, capturing real-time atmospheric parameters and surface deformation during storm events.
How Remote Sensing Gives Storm Chasers a Precision Edge
When you combine multi-spectral satellite imagery, dual-polarization radar, and AI-driven computer vision into a single operational workflow, storm chasing transforms from reactive pursuit into precision science. Data fusion integrates these independent streams into unified situational awareness, letting you detect rotation signatures, debris fields, and vegetation disturbance simultaneously.
Satellite calibration guarantees spectral accuracy across sensors, eliminating measurement drift that corrupts NDVI analysis or thermal readings during rapid storm evolution. Phased array radar accelerates volumetric scanning beyond WSR-88D limitations, while convolutional neural networks classify damage zones in near real-time.
You’re no longer dependent on visual confirmation alone. Instead, you’re operating with layered, validated datasets that quantify atmospheric dynamics with centimeter-level precision, giving you the analytical freedom to intercept tornadoes confidently and document them with scientific rigor.
Track Tornado Paths With Satellite Imagery and NDVI
When a tornado cuts through forested terrain, you can track its path by analyzing multi-spectral satellite imagery for disturbed vegetation signatures that ground spotters often miss entirely.
You’ll apply NDVI analysis by combining red-visible and near-infrared wavelengths to assess vegetation health at the pixel level, isolating damaged canopy from surrounding intact growth.
This pixel-level health mapping lets you reconstruct the tornado’s ground track with measurable precision, even across remote, sparsely populated regions.
Detecting Disturbed Vegetation Patterns
Tornadoes cutting through forested or rural terrain often leave no ground-level witnesses, but multi-spectral satellite imagery fills that observational gap by detecting disturbed vegetation patterns along the damage path. When a tornado strips, snaps, or uproots vegetation, it creates measurable vegetation stress signatures that remote sensing platforms capture with precision.
You’ll analyze red-visible and near-infrared wavelength combinations to generate NDVI values, where healthy canopy registers high scores and tornado-disturbed zones register sharp contrasts. Those spectral discontinuities trace the damage corridor with spatial accuracy unavailable from ground surveys alone.
Enhanced EOS visual imagery further highlights these disruption zones in remote regions, giving you independent confirmation of tornado occurrence and path orientation without relying on sparse spotter networks or incomplete storm reports.
Mapping NDVI Pixel Health
Each pixel in an NDVI composite tells a story about vegetation health, and you’ll exploit that data structure to reconstruct tornado tracks at sub-field resolution. By combining red-visible and near-infrared wavelengths, you generate index values ranging from -1 to +1, where sharp negative deviations flag acute vegetation stress along damage corridors.
You’ll apply pixel classification algorithms to segment healthy canopy from mechanically stripped or uprooted biomass, isolating the tornado’s precise ground signature. Threshold your pre-event and post-event NDVI differentials, then run supervised classification to assign damage-intensity categories across the affected swath.
This approach converts raw spectral data into a quantifiable damage gradient, letting you independently verify tornado paths through remote terrain where ground spotters never reach.
Identify Tornado Vortex Signatures With Dual-Polarization Radar
Dual-polarization radar gives storm chasers a decisive edge in confirming tornado vortex signatures by transmitting and receiving both horizontal and vertical microwave pulses simultaneously. This dual-axis transmission lets you distinguish tornado debris signatures from precipitation returns with far greater accuracy than single-polarization systems allow.
When a tornado vortex lofts irregular debris, the correlation coefficient (CC) drops sharply—typically below 0.80—while differential reflectivity (ZDR) values scatter erratically. You’re reading chaotic, asymmetrical targets rather than uniform raindrops.
Cross-referencing CC anomalies against storm-relative mean radial velocity fields isolates rotation signatures invisible on standard Doppler displays. Dual polarization fundamentally provides a multi-variable confirmation framework, letting you independently verify vortex presence without relying solely on visual confirmation or spotter reports from the field.
See Through Storm Clouds Using Synthetic Aperture Radar
When storm clouds block your optical sensors, you can switch to Synthetic Aperture Radar, which emits microwave pulses that penetrate cloud cover day or night to image the surface below.
You’ll detect surface deformation at millimeter-scale precision using Interferometric SAR, which compares multi-temporal radar acquisitions to reveal ground displacement caused by severe storm impacts.
For flood extent mapping, you can process Sentinel-1 GRD data with VV polarization, applying backscatter difference thresholds to rapidly delineate inundated areas across your target region.
All-Weather Microwave Imaging
Unlike optical sensors that cloud cover renders useless during active storm events, Synthetic Aperture Radar (SAR) emits microwave pulses that penetrate clouds, rain, and darkness to deliver consistent surface imagery regardless of atmospheric conditions. You gain operational independence that traditional imaging systems simply can’t provide when severe weather obscures the ground.
Sentinel-1 GRD data with VV polarization lets you apply backscatter thresholding to identify storm-related surface changes with precision. Proper satellite calibration ensures your microwave return signals translate into accurate, measurable measurements rather than distorted readings.
When you integrate SAR outputs through data fusion with optical and infrared streams, you build a thorough situational picture. InSAR further detects surface deformation down to millimeter-scale displacement, giving you subsurface movement intelligence no storm spotter network can replicate.
Surface Deformation Detection Methods
Interferometric SAR (InSAR) compares radar images acquired at different orbital passes to detect surface displacement as small as a few millimeters, giving you a deformation measurement capability no ground-based sensor network can match.
By analyzing phase differences between Sentinel-1 GRD passes, you’ll identify ground subsidence zones where storm-saturated soils have compressed beneath structural loads. Soil liquefaction signatures appear as coherent deformation gradients across InSAR interferograms, pinpointing unstable terrain before ground crews enter affected areas.
You’re processing VV-polarization backscatter differentials to threshold storm-related surface changes with precision that optical sensors can’t deliver through cloud cover. This microwave-based methodology operates continuously through precipitation, darkness, and dense cloud layers, letting you reconstruct post-storm deformation fields independently of atmospheric interference that would otherwise blind your entire sensor suite.
Flood Mapping With Sentinel-1
SAR’s deformation mapping capability extends directly into flood extent analysis, where Sentinel-1’s microwave pulses cut through the same storm cloud layers that defeat your optical sensors entirely.
You’re working with VV polarization backscatter thresholding to distinguish inundated surfaces from dry terrain, giving you actionable flood risk intelligence when visibility is zero.
Maximize your Sentinel-1 workflow with these calibrated steps:
- Apply radiometric SAR calibration to sigma-nought values before any thresholding operation
- Compare pre-event and post-event GRD acquisitions to isolate backscatter differences exceeding your threshold margin
- Mask urban infrastructure returns that artificially inflate flood extent boundaries
This methodology delivers independent, cloud-penetrating flood mapping that keeps you operationally aware regardless of what the atmosphere throws overhead.
Collect Low-Altitude Storm Data With UAS and LiDAR
When orbital satellites can’t resolve sub-meter structural damage or penetrate dense forest canopy, UAS and LiDAR fill the gap. UAS deployment puts your sensors directly inside the boundary layer, capturing atmospheric pressure, wind shear, and thermal gradients that satellite platforms simply can’t reach.
Pair that with LiDAR precision and you’re generating centimeter-accurate 3D point clouds of debris fields, downed timber, and surface deformation in real time. Unlike passive optical sensors, LiDAR pulses penetrate canopy gaps to map ground-level tornado signatures in densely vegetated terrain where spotters can’t operate.
Structure from motion complements LiDAR by reconstructing terrain models from overlapping imagery, giving you redundant verification of damage extent.
Together, these tools give you autonomous, high-resolution storm data that no orbital asset can match.
Detect Storm Damage Signatures With Thermal Infrared Sensors
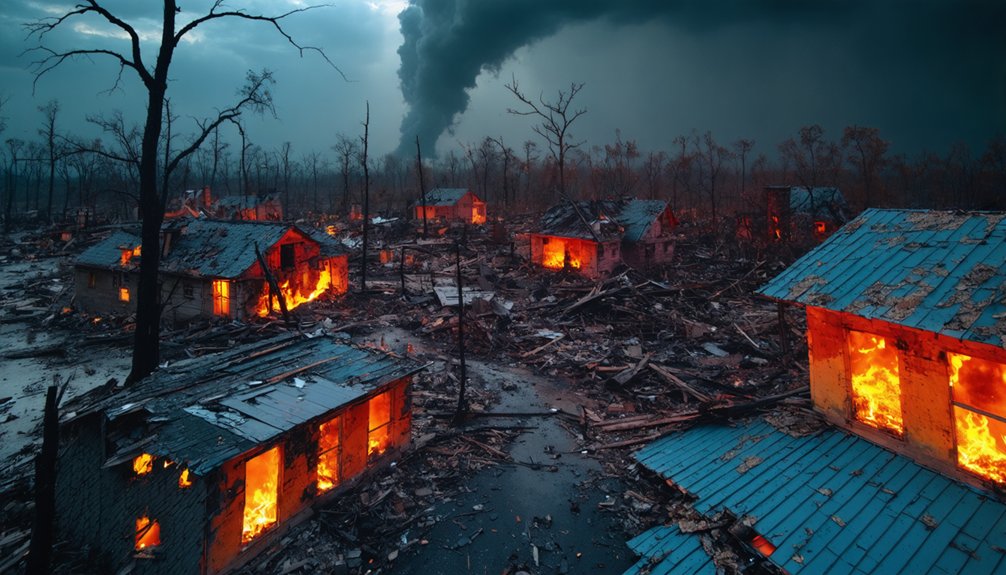
Thermal infrared sensors detect heat energy emitted directly from Earth’s surface, giving you a spectral layer that optical and radar systems can’t replicate. Post-storm thermal anomalies reveal structural damage, exposed soil, and fire activity invisible to standard imaging. You’re capturing heat signatures that confirm ground-truth conditions independently of cloud cover or daylight constraints.
Thermal infrared sensors capture what optical and radar systems can’t — heat signatures that confirm ground-truth conditions regardless of cloud cover or daylight.
Prioritize TIR integration for these damage indicators:
- Exposed substrate signatures — stripped vegetation and bare soil emit distinct thermal contrasts against intact canopy.
- Storm-induced fire detection — TIR isolates active combustion zones within debris fields at orbital resolution.
- Structural thermal differentials — damaged buildings lose insulation integrity, producing measurable surface temperature anomalies detectable from GOES or airborne platforms.
Cross-referencing TIR outputs against NDVI and SAR datasets sharpens your damage boundary delineation considerably.
Automate Debris Detection With AI and Computer Vision
Manually scanning post-storm imagery across hundreds of square kilometers isn’t scalable—AI-driven computer vision solves this throughput problem by automating debris detection at speeds no analyst team can match.
Convolutional neural networks classify spectral, shape, and texture signatures within post-event imagery, flagging damage zones without manual review.
You’ll leverage sensor fusion by combining SAR backscatter differentials, NDVI disruption layers, and thermal anomaly data into unified model inputs, dramatically improving classification accuracy over single-source pipelines.
Google Earth Engine’s cloud infrastructure processes these fused datasets at continental scale in near real-time.
Rigorous data annotation remains critical—poorly labeled training sets introduce systematic misclassification errors that propagate across entire storm tracks.
Prioritize curated, multi-sensor annotation libraries to maintain detection precision when autonomous systems operate under time-critical field conditions.
Frequently Asked Questions
What Licenses Do Storm Chasers Need to Legally Operate UAS Equipment?
Cut to the chase: you’ll need FAA Part 107 certification to meet drone regulations and licensing requirements. This credential lets you legally fly UAS equipment for storm chasing operations across U.S. airspace.
How Much Does Accessing High-Resolution Worldview-3 Satellite Imagery Typically Cost?
Satellite pricing for WorldView-3 varies, but you’ll typically spend $10–$30 per square kilometer for imagery costs. Tasking fresh captures runs higher, while archive pulls offer budget-friendly alternatives for analyzing storm debris tracks.
Can Remote Sensing Data Be Used as Legal Evidence After Tornado Events?
Yes, you can use remote sensing data as legal evidence post-tornado. Guarantee legal admissibility through proper evidence validation—documenting SAR, NDVI, and LiDAR data chains meticulously, as courts increasingly accept georeferenced, timestamped remote sensing outputs supporting damage litigation.
What Internet Speeds Are Required for Real-Time Cloud-Based Storm Data Processing?
You’ll need minimum 25 Mbps upload speeds for real-time cloud-based storm data processing. Prioritize data encryption to secure transmissions, and verify satellite calibration aligns with your pipeline to maintain analytical integrity across distributed processing nodes.
How Do Storm Chasers Physically Mount Radar Overlay Systems in Chase Vehicles?
You’ll mount radar overlay systems using ruggedized roof racks requiring precise antenna installation and vehicle modifications, including reinforced cable routing, waterproof connectors, and vibration-dampening brackets to maintain signal integrity across multiple meteorological data streams during high-speed intercepts.
References
- https://www.frontiersin.org/journals/built-environment/articles/10.3389/fbuil.2018.00066/full
- https://nesplandscapes.edu.au/wp-content/uploads/2016/06/Emerging-trends-in-remote-sensing-Doug-Ward.pdf
- https://www.nssl.noaa.gov/tools/observation/
- https://aigeo360.com/remote-sensing-services-10-most-powerful-techniques/
- https://crazystormchasers.com/enhancing-weather-tracking-techniques-for-storm-chasers/
- https://pmc.ncbi.nlm.nih.gov/articles/PMC8951235/
- https://www.ncbi.nlm.nih.gov/pmc/articles/PMC8050951/
- https://www.stormtours.com/information/nowcasting-explained/
- https://www.linkedin.com/posts/cnn_storm-chaser-and-research-scientist-sean-activity-7342196754647248897-jtLD