You’ll maximize intercept success by layering Level 2 radar’s high-resolution data with geostationary satellite imagery for continuous monitoring. Integrate crowd-sourced chaser reports as verified ground truth, while accessing NSSL experimental products for specialized warnings. Cross-reference mobile mesonet surface parameters with radar beam geometry to avoid underestimated readings from improper tilt angles. Strategic data fusion transforms isolated measurements into actionable intelligence, eliminating reliance on delayed official channels. The systematic approach outlined below establishes protocols for coordinating these disparate streams into cohesive operational awareness.
Key Takeaways
- Select distant radars over nearby high-elevation scans to capture complete vertical storm structure and avoid underestimated readings.
- Use geostationary satellite time-lapse sequences to identify rapid convective development and detect supercell signatures with gap-free monitoring.
- Deploy in-situ atmospheric probes with staggered launches to sample inflow conditions and map heterogeneous storm environments in real-time.
- Layer Level 3 radar for quick updates with Level 2 high-resolution detail while integrating mobile mesonets for surface parameters.
- Cross-reference crowd-sourced chaser reports with radar and satellite data to create actionable intelligence without delayed official channels.
Selecting Appropriate Radar Data Levels for Field Conditions
Radar beam geometry fundamentally determines data quality in storm chasing operations. You’ll find that analyzing precipitation patterns requires understanding how tilt angles affect sampling effectiveness at various distances.
When interpreting precursor indicators of severe weather, nearby radars scanning at highest elevations often miss storm tops entirely—Tilt 1 samples around 7,000 feet while Tilt 2 reaches 13,600 feet at comparable ranges. You’re better served selecting distant radar sources that capture complete vertical structure rather than relying on close-range stations with geometric constraints.
Higher echotops values exceeding 18 dBz between 5,000 and 70,000 feet indicate robust updraft development, but only when beam geometry permits accurate sampling. Strategic radar selection liberates you from underestimated readings that compromise situational awareness during active intercepts.
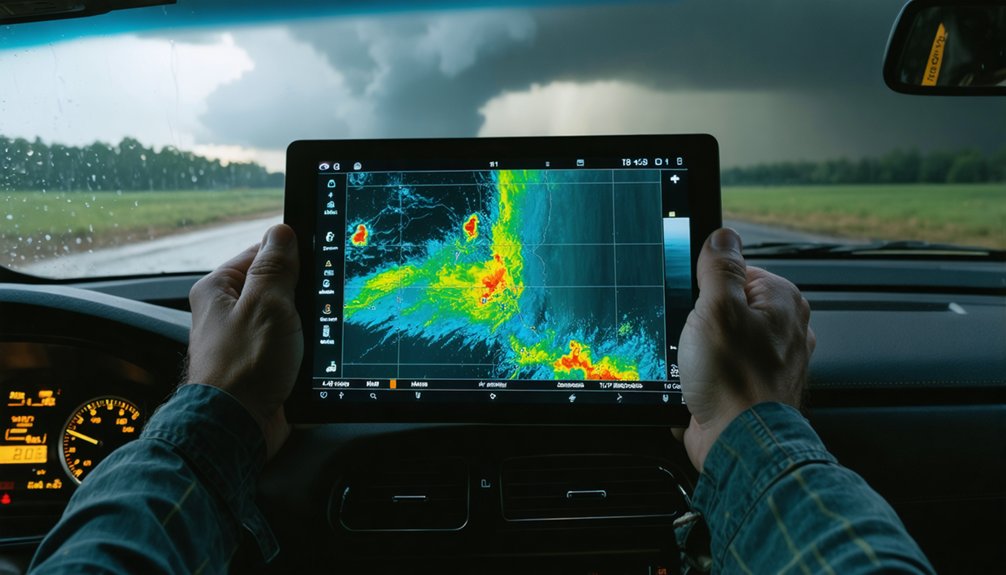
Leveraging Satellite Imagery for Nowcasting Applications
Geostationary satellites maintain fixed positions over Earth’s surface, providing continuous monitoring of your target area without the coverage gaps inherent to polar-orbiting systems.
You’ll identify rapid convective development by analyzing time-lapse sequences at 1-10 minute intervals, tracking infrared brightness temperature decreases exceeding 8°C per 15 minutes that indicate explosive updraft formation.
In data-sparse regions where ground-based radar networks don’t exist, satellite-derived convective signatures—including overshooting tops, enhanced-V patterns, and cold-ring structures—become your primary tools for detecting supercell characteristics and tornado potential.
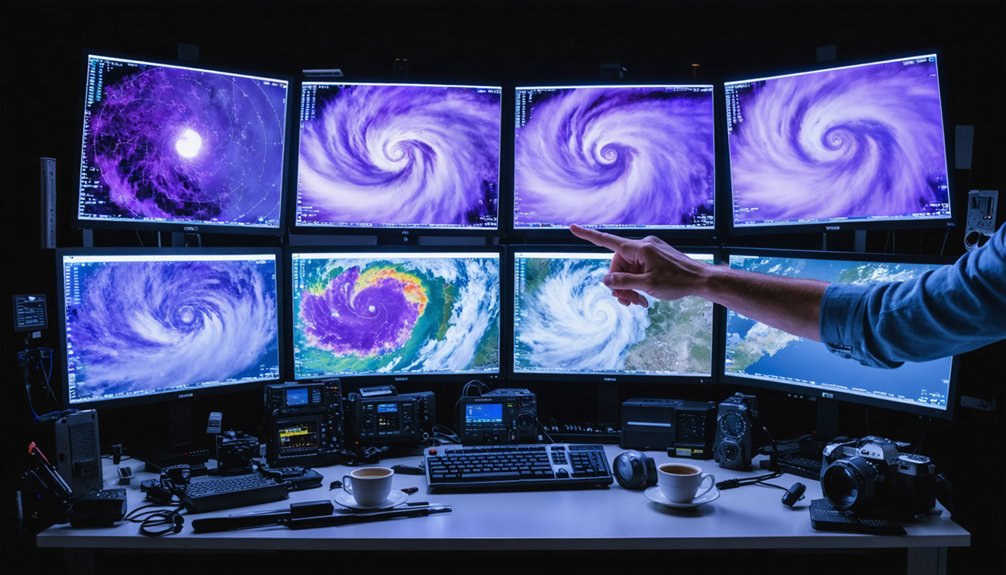
Geostationary Orbit Coverage Advantages
While storm chasers have long relied on ground-based radar networks, satellite imagery from geostationary orbit provides complementary surveillance capabilities that fill critical gaps in severe weather monitoring. Simplified geostationary monitoring maintains a fixed position above Earth’s surface, enabling continuous high definition surveillance of one-third of the planet without perspective shifts. This stationary vantage point delivers distinct operational advantages:
- Persistent Regional Coverage: You’ll maintain uninterrupted observation of developing storm systems across North America and adjacent oceanic regions where radar coverage doesn’t exist.
- Temporal Consistency: The fixed geometry provides stable basemap references for tracking atmospheric particulate movement and storm evolution patterns.
- Broad-Scale Context: You’ll visualize mesoscale convective systems within their synoptic environment, identifying convergence zones and outflow boundaries.
- Gap-Free Monitoring: Continental-scale scans occur every five minutes, capturing rapid intensification events between radar volume scans.
Identifying Rapid Cloud Development
Beyond establishing persistent surveillance coverage, satellite imagery provides storm chasers with specific detection capabilities that translate directly into tactical deployment decisions. Cloud top analysis through infrared wavelengths reveals temperature gradients that indicate convective intensity—rapid cooling signals powerful updrafts worth pursuing. You’ll identify overshooting tops and gravity wave patterns that precede severe weather development.
Microwave precipitation data at 37 gigahertz penetrates cloud shields to expose subsurface storm structure before ground-based radar detection. This advance warning enables positioning ahead of intensification cycles. Combine infrared temperature signatures with microwave returns to assess storm organization autonomously.
Cloud motion vectors reveal convergence zones where agitated formations mark imminent initiation points. One-minute mesoscale sector refreshes let you track inner-storm features in real-time, while lightning integration confirms electrical intensification matching satellite-observed cold tops.
Convective Signatures in Data-Sparse Regions
When ground-based radar networks leave coverage gaps—particularly across remote terrain, international borders, or oceanic approaches—satellite imagery becomes your primary detection instrument for convective initiation. You’ll decode multilevel cloud signatures through systematic pattern recognition:
- Comma-shaped formations reveal turbulent convection near air mass boundaries where instability concentrates
- Southwest-northeast elongated clouds mark trough-associated storm corridors tracking with jet stream flow
- Enhanced-V patterns on visible imagery identify explosive updrafts fanning outward from cold cloud tops
- Outflow boundary features appear as arcuate cloud lines post-storm, targeting secondary development zones
Optical flow analysis between sequential frames quantifies rotation and divergence fields, predicting storm evolution minutes ahead of ground observations. In radar-void territories, these orbital perspectives deliver actionable nowcasts when surface networks can’t.
Deploying In-Situ Atmospheric Probes for Storm Analysis
Your probe deployment strategy requires precise timing calculations based on storm evolution models and anticipated mesocyclone development phases. You’ll maximize data density by implementing systematic launch patterns that account for probe descent rates of 11 m/s and relay communication windows limited to 75 minutes.
Real-time telemetry on the 915MHz ISM band enables immediate integration of temperature, humidity, and pressure measurements into your nowcasting analysis workflow.
Probe Launch Timing Strategy
Your timing protocol should incorporate:
- Pre-storm launches 13-30 km east of mesocyclones to sample inflow characteristics
- Staggered deployments using 915MHz time-division protocols for simultaneous operations
- Sensor response corrections applying 11-second adjustments for thermodynamic accuracy
- Real-time transmission verification through forward error correction algorithms
This systematic approach transforms reconnaissance missions into high-resolution atmospheric mapping operations, delivering actionable data that sparse networks can’t provide.
Real-Time Data Collection Methods
Successful probe launches require hardware specifically engineered for atmospheric measurement extremes. Your sensor configuration optimization starts with multi-hole probe (MHP) systems measuring pressure, temperature, humidity, and 3D winds on fixed-wing platforms.
You’ll deploy dropsondes exhibiting terminal velocities of 11 m/s at sea level, accelerating to 21 m/s at 12 km altitude. The 915MHz ISM band communication protocol employs time-division multiple access, enabling simultaneous data streams from multiple eMotes. Forward error correction enhances signal-to-noise ratios during transmission through severe weather.
Storm environment parameter analysis demands accelerometers for upper atmospheric density profiles, while nephelometers assess cloud composition and aerosol distribution. PASIV instruments capture high-definition particle imagery alongside electric field strength measurements.
You’re obtaining thermal structure, dynamics, and wave data that remote sensing can’t provide for real-time model initialization.
Optimal Deployment Pattern Calculations
Strategic positioning of atmospheric probes determines measurement quality across heterogeneous storm environments. You’ll optimize probe deployment sequencing by analyzing terrain-relative wind patterns and targeting subsiding air zones near tornado cores. Your computational modeling requirements depend on coordinated multi-probe arrays that capture spatial variations under 100 km scales.
Effective deployment patterns include:
- Figure-4 survey sequences positioning 8-12 GPS dropsondes relative to eyewall features at coordinated altitudes
- Inner-core array placement over deep water capturing maximum winds up to 60 m/s
- Model rocket trajectories penetrating EF4 inflow layers with LoRa-enabled tracking
- Concurrent measurement strategies filling temporal gaps that polar-orbiting satellites can’t sample
You’ll achieve terminal velocities ranging from 11 m/s at sea level to 21 m/s at altitude, enabling real-time flux budget calculations for storm-scale dynamics.
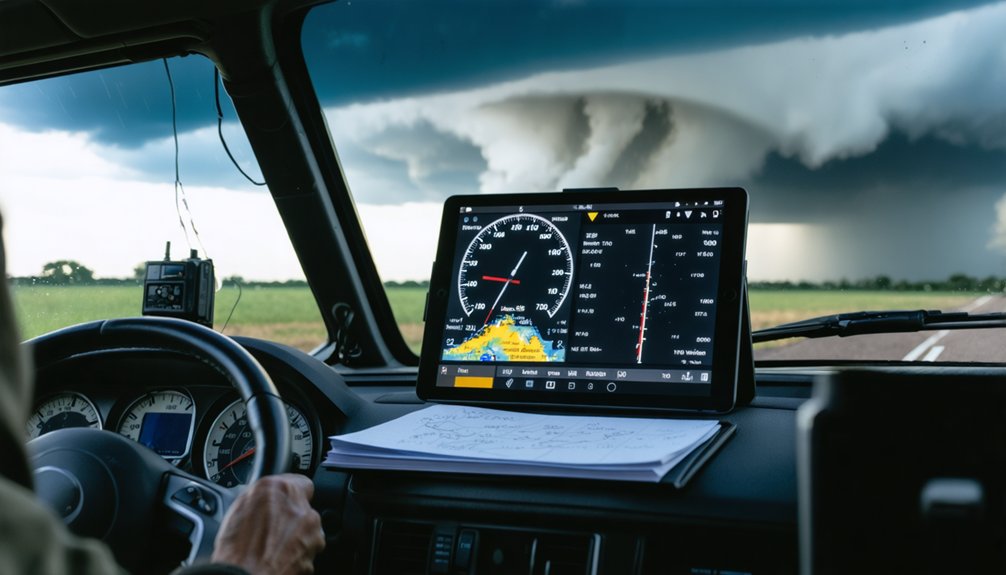
Essential Software Tools and Network Resources
Modern storm chasers rely on three distinct software categories to maintain safety and maximize intercept success: real-time radar visualization platforms, mobile situational awareness applications, and specialized meteorological modeling tools.
Three software categories form the technological foundation of modern storm chasing: radar visualization, mobile awareness, and meteorological modeling systems.
GRLevel2 and RadarScope deliver Super-Resolution Level II data streams, enabling precise velocity analysis and rotation detection. You’ll need multi sensor data fusion capabilities through platforms like Supercell Wx, which combines NEXRAD reflectivity with velocity overlays on responsive maps.
Network resources amplify your operational effectiveness. SpotterNetwork integration with RadarScope Pro provides real-time positioning data of nearby chasers, while StormCenter enables 24-hour storm rewind capability and tornado report tracking. You’ll maintain live social media monitoring through Periscope for crowd-sourced ground truth verification.
GEMPAK servers run customized mesoscale models, while SVC Mesoanalysis delivers high-resolution satellite imagery for nowcasting operations.
Integrating Real-Time Reports and Ground-Based Measurements
While radar platforms provide the structural framework for storm analysis, real-time ground-based measurements and spotter reports deliver the granular data that confirms intercept positioning and validates mesocyclone evolution. You’ll access chaser crowd sourced reports through mobile apps that overlay verified storm observations onto radar displays, eliminating dependency on delayed official channels.
Live instrument dashboards from mobile mesonets transmit critical surface parameters:
- Wind velocity measurements up to 90 m/s from FT752-PM sensors certified for extreme conditions
- Temperature, pressure, and humidity gradients indicating frontal boundaries and outflow signatures
- Real-time freezing rain accumulation from NSSL experimental products for winter storm intercepts
- Radar-derived downburst signatures detecting cold, dense air preceding damaging winds
These integrated data streams enable autonomous route adjustments based on verified ground truth rather than interpolated model outputs.
Building a Multi-Source Data Strategy for Mobile Operations
Ground truth validation from individual sensors and spotters gains exponential value when you architect a synchronized multi-source framework that cross-references disparate data streams during rapid storm evolution.
You’ll achieve ideal situational awareness by layering Level 3 radar for quick updates with Level 2’s high-resolution detail when bandwidth permits. Integrate mobile Doppler trucks scanning from multiple angles to construct 3D wind fields, while GPS-tracked probes deliver temperature-humidity profiles that validate radar-derived signatures.
Satellite platforms fill observational gaps where ground-based networks can’t reach, establishing data quality benchmarking across all sources. Private weather servers enable custom processing algorithms tailored to your chase methodology.
This observational data synchronization transforms isolated measurements into actionable intelligence, letting you position strategically without regulatory constraints or institutional delays limiting your operational freedom.
Frequently Asked Questions
How Do Storm Chasers Maintain Power for Data-Intensive Devices During Extended Field Operations?
You’ll maintain power through portable power options like vehicle-mounted inverters, backup generators, and lithium-ion batteries. Energy efficient device selection reduces consumption, while hybrid solar systems and redundant battery packs guarantee you’re never offline during critical intercepts.
What Backup Communication Methods Work When Cellular Networks Fail in Remote Areas?
You’ll maintain contact through amateur radio on 146.580 MHz, satellite-based messaging like Garmin inReach, and high-frequency radio for extended range. GMRS/MURS radios provide team coordination, while SKYWARN repeaters guarantee reliable National Weather Service connectivity across 30-mile coverage zones.
How Much Does a Complete Storm Chasing Meteorological Software Suite Typically Cost?
You’ll spend $50-$600 annually for meteorological software, depending on your forecasting accuracy needs and data storage requirements. RadarOmega’s subscriptions run $49-$119 yearly, while specialized tools like WeatherMaster cost $435 upfront, giving you complete operational independence.
What Training or Certification Is Recommended Before Deploying Atmospheric Probes Into Supercells?
You’ll need specialized meteorological field training covering proper safety protocols and instrument calibration practices. While no formal certification exists, organizations like NSSL and NWA offer workshops teaching autonomous probe deployment techniques for severe weather research operations.
How Do Chasers Coordinate Data Sharing Among Multiple Vehicles in the Field?
You’ll coordinate through fleet-based mobile Doppler networks where reports reach platforms within five seconds. Real-time coordination strategies use Spotter Network tracking software, while data aggregation techniques combine video streams, sensor feeds, and AI-analyzed alerts across your independent vehicle teams.