When you chase storms, atmospheric analysis transforms raw environmental data into life-or-death decisions. You’re cross-referencing four critical parameters: moisture, instability, wind shear, and lift. CAPE values above 1,000 J/kg signal serious storm development potential, while directional wind shear exceeding 40 knots enables supercell rotation. Missing any single variable distorts your entire risk assessment. Understanding these interconnected conditions separates calculated pursuit from reckless exposure, and there’s far more precision behind how experienced chasers apply this data in the field.
Key Takeaways
- Storm chasers analyze atmospheric conditions to predict storm formation by monitoring CAPE values, moisture levels, wind shear, and lift simultaneously.
- CAPE values exceeding 2,500 J/kg signal credible supercell and tornado threats, helping chasers determine whether severe weather is likely.
- Wind shear analysis reveals storm organization potential, with 0-6 km bulk shear exceeding 40 knots enabling dangerous, sustained supercell rotation.
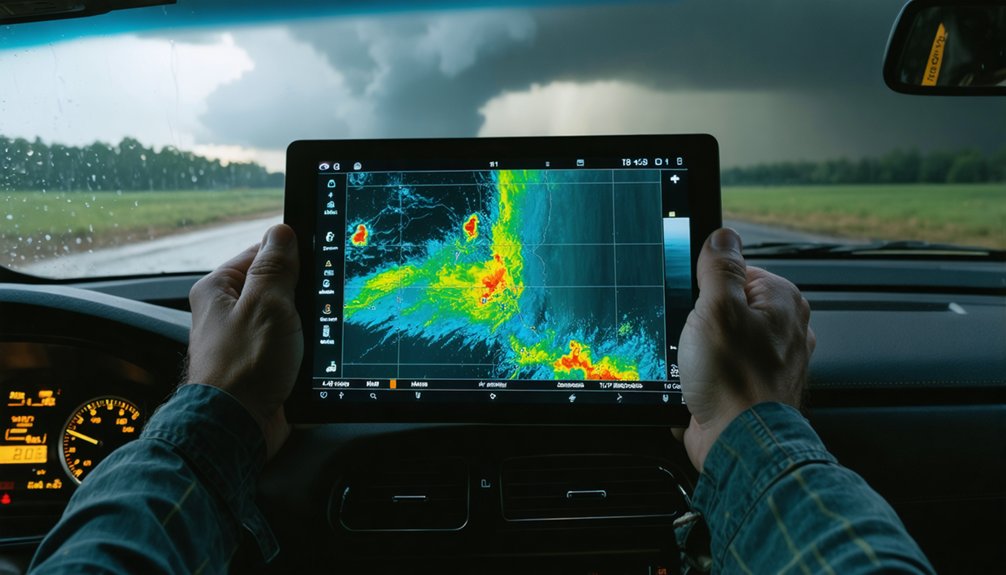
- Real-time radar, satellite imagery, and mobile applications allow chasers to track storm intensification and make rapid, informed positioning decisions.
- Analyzing conditions improves public safety by generating community alerts, validating radar signatures, and contributing data to severe weather forecast models.
The Four Atmospheric Parameters Storm Chasers Analyze First
When storm chasers evaluate severe weather potential, they prioritize four atmospheric parameters: moisture, instability, wind shear, and lift. These elements drive storm dynamics and determine whether atmospheric interactions produce dangerous conditions.
Moisture fuels convection, while instability—measured through CAPE values exceeding 1000—signals explosive storm development potential. Wind shear organizes storm structure, enabling rotating updrafts characteristic of supercells. Lift triggers initial storm initiation through frontal boundaries, outflow boundaries, or terrain features.
You’ll find that no single parameter guarantees severe weather. Chasers cross-reference all four simultaneously, using Skew-T diagrams and mesoscale analysis maps to quantify each variable.
This analytical approach lets you distinguish between ordinary convection and genuinely dangerous storm environments before committing to a chase, maximizing both scientific yield and personal safety.
CAPE Values and Why They Signal Dangerous Storm Potential
When you assess atmospheric instability, Convective Available Potential Energy (CAPE) serves as your primary quantitative benchmark, with values exceeding 1,000 J/kg signaling meaningful storm development potential.
You’ll treat readings above 2,500 J/kg as indicators of severe thunderstorm risk, while values surpassing 4,000 J/kg place you in extreme instability territory where violent supercells and tornadoes become plausible outcomes.
Understanding CAPE Value Thresholds
Convective Available Potential Energy (CAPE) measures the buoyant energy available to rising air parcels, and storm chasers treat it as one of the most critical instability parameters in their pre-chase analysis.
Understanding CAPE thresholds sharpens your atmospheric analysis and reveals where severe weather becomes genuinely dangerous:
- 0–1,000 J/kg – Minimal instability; storm development remains unlikely.
- 1,000–2,500 J/kg – Moderate instability; organized thunderstorms possible.
- 2,500–3,500 J/kg – High instability; supercells and tornadoes become credible threats.
- 3,500+ J/kg – Extreme instability; life-threatening severe weather almost certain.
These thresholds aren’t arbitrary—they’re data-driven boundaries chasers use to protect your freedom to move safely.
Respecting CAPE values means you’re making informed decisions, not gambling with atmospheric forces you can’t control.
CAPE’s Role in Forecasting
However, CAPE limitations matter equally. High CAPE without sufficient lift or moisture convergence produces no storms at all.
You must integrate mesoscale analysis maps and wind shear data alongside CAPE readings—relying on a single parameter compromises your forecast reliability and ultimately your warning accuracy.
How Wind Shear and Moisture Shape Supercell Formation
Supercell thunderstorms demand two atmospheric ingredients above all else: directional wind shear and sufficient boundary-layer moisture. When you’re analyzing pre-storm environments, these variables determine whether rotating updrafts organize or collapse entirely.
Moisture analysis reveals dewpoints—typically above 55°F—fueling explosive convective energy. Wind shear then tilts that energy, preventing storms from choking on their own rainfall.
Dewpoints fuel the fire. Wind shear directs it—keeping storms alive instead of drowning in their own rain.
Here’s what separates survivable storms from catastrophic ones:
- Veering winds between surface and 500mb generate horizontal vorticity
- Dewpoint depressions below 10°F signal explosive moisture availability
- 0-6km bulk shear exceeding 40 knots enables sustained supercell rotation
- Low-level jet streams intensify wind shear overnight, dramatically increasing tornado probability
You’re not guessing—you’re decoding atmospheric freedom and constraint simultaneously.
Radar, Satellites, and Apps Storm Chasers Rely On in the Field
Once you’ve decoded the pre-storm atmospheric parameters, real-time technology becomes your operational backbone.
Radar technology delivers velocity and reflectivity data, exposing rotation signatures and hook echoes within developing supercells. You’ll monitor dual-polarization returns to distinguish hail cores from precipitation, sharpening your positioning decisions instantly.
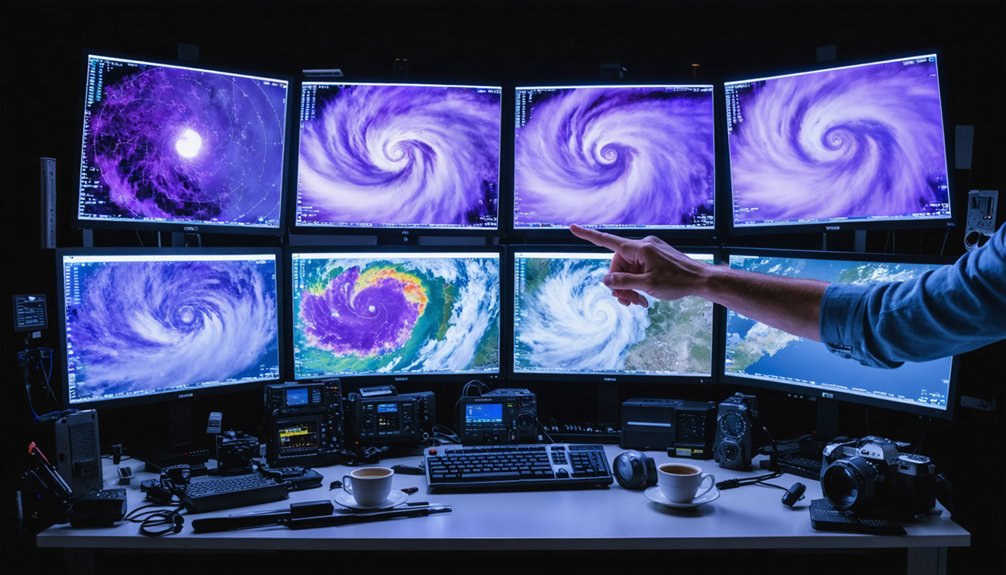
Satellite imagery fills critical gaps where radar coverage weakens, tracking storm formation cycles every 15 minutes through GOES-16’s high-resolution feeds.
You’re watching cloud-top temperatures plummet, signaling rapid intensification before ground-level evidence appears.
Mobile applications synthesize these data streams into actionable storm tracking overlays.
Apps like RadarScope deliver NEXRAD data directly to your device, letting you intercept without anchoring yourself to fixed infrastructure.
You’re operating independently, making informed decisions wherever severe weather develops, unconstrained by traditional forecasting dependencies.
How Storm Chasers Read a Skew-T Diagram on the Ground
When you examine a Skew-T diagram in the field, you’re identifying discrete atmospheric instability layers by tracing the temperature and dewpoint curves to locate areas where steep lapse rates and high moisture convergence signal convective potential.
You read CAPE values directly from the area between the environmental and parcel temperature curves, with values exceeding 1000 J/kg confirming significant storm development risk.
Wind barbs plotted at pressure levels along the diagram’s right edge let you quantify directional and speed shear, revealing whether the hodograph structure supports supercell organization or tornadic potential.
Decoding Atmospheric Instability Layers
A Skew-T log-P diagram compresses a vertical atmospheric profile into a single chart that storm chasers decode roadside to assess convective potential before committing to a chase.
Layer analysis reveals temperature gradients, moisture stratification, and environmental triggers that drive storm behavior. You’re reading atmospheric profiles to predict cloud dynamics before they unfold.
Four instability layers demanding your attention:
- Lifted Condensation Level — marks where moisture stratification triggers initial cloud formation.
- Level of Free Convection — identifies the environmental trigger releasing explosive instability forecasting potential.
- Equilibrium Level — defines storm behavior’s vertical ceiling through temperature gradients.
- Convective Inhibition Layer — measures the cap suppressing cloud dynamics until atmospheric profiles destabilize sufficiently.
Each layer tells you whether nature’s about to release controlled chaos or stay suppressed.
Interpreting Wind Shear Profiles
Beyond the instability layers you’ve already mapped, the hodograph embedded in your Skew-T diagram reveals wind shear data that determines whether a storm organizes into a supercell or collapses into disarray.
You’ll trace the hodograph’s curve to quantify directional and speed changes across altitude bands, executing precise shear layer analysis between 0–1 km and 0–6 km levels.
Wind shear effects become actionable intelligence when hodograph arc lengths exceed 40 knots in the 0–6 km layer, signaling strong rotational potential.
You’re cross-referencing these values against mesoscale analysis maps to confirm regional shear gradients. If your 0–1 km layer shows tight directional turning, low-level rotation becomes probable.
This data lets you independently assess storm structure before committing to an intercept position.
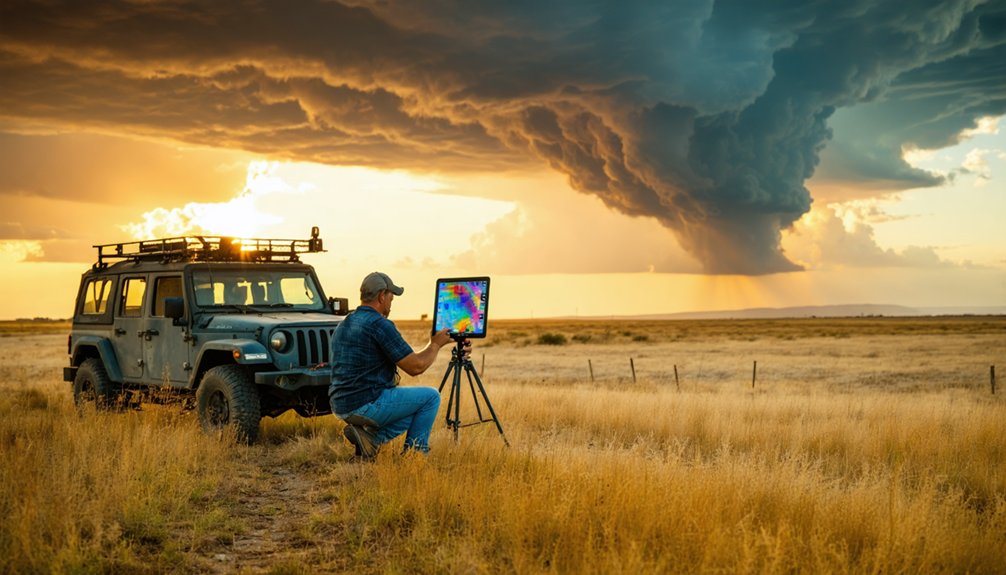
How Storm Chasers Turn Raw Atmospheric Data Into Live Warnings
Storm chasers transform raw atmospheric data into live warnings through a rapid, multi-step analytical process that bridges field observations and public safety systems.
Using vehicle-mounted stations and drones, they collect temperature, pressure, and wind data instantly. That information feeds directly into storm tracking systems, generating real time alerts for communities in a storm’s path.
Here’s what that process delivers:
- Nowcasting pinpoints hour-by-hour storm trajectories with precision.
- Ground truth reports validate radar signatures, sharpening warning accuracy.
- CAPE and wind shear analysis identifies escalating tornadic potential before rotation develops.
- Direct communication pushes alerts to people who still have time to act.
You’re not just watching data move across a screen—you’re witnessing the mechanism that keeps people free to make life-saving decisions.
Why Chasers’ Field Observations Make Future Storm Forecasts More Accurate
Every field observation a chaser logs becomes a data point that sharpens the statistical foundation of future forecast models. When you submit real time data on wind shear, CAPE values, and hail size, you’re directly feeding verification datasets that meteorologists use to recalibrate numerical weather prediction algorithms.
Those corrections reduce forecast error margins over successive storm seasons.
Collaborative forecasting amplifies this impact further. Universities partnering with chasers through projects like VORTEX-SE integrate your ground-truth reports with radar and satellite inputs, refining tornado genesis models with empirical precision.
Each confirmed supercell observation you document strengthens severe storm climatology databases, improving warning lead times systematically.
You’re not just reacting to storms—you’re building the analytical infrastructure that gives future forecasters sharper tools and communities stronger protection.
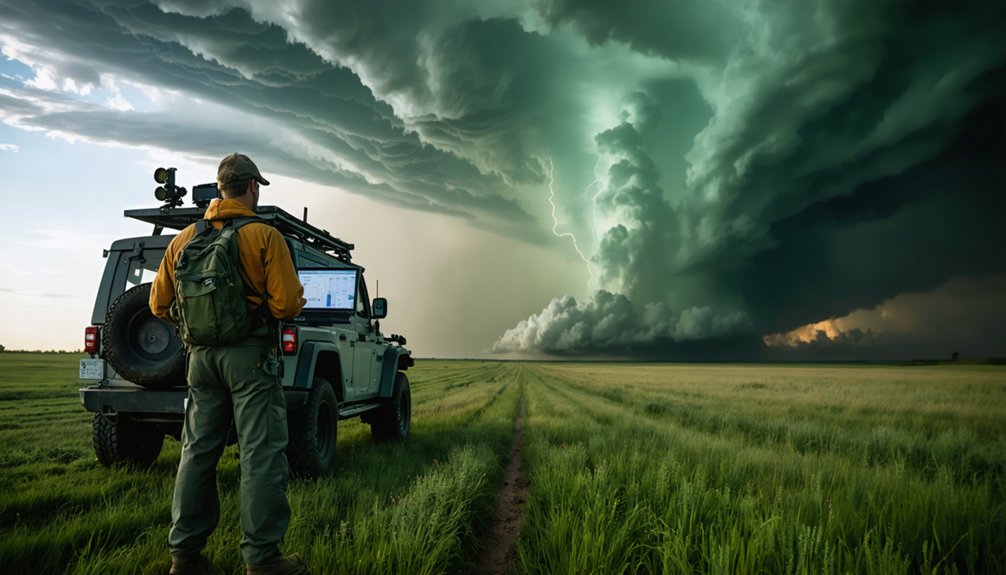
Why Chasing in the Southeast Demands a Completely Different Approach
Chasing in the Southeast forces you to abandon the open-horizon playbook that works on the Plains. Southeast challenges demand unique adaptations because dense forests, rolling terrain, and tight road networks severely restrict visibility and escape routes.
Here’s what separates Southeast chasing from everything else:
- Storms intensify rapidly, giving you minutes—not hours—to reposition safely.
- Nocturnal tornadoes strike frequently, stripping away your visual reference entirely.
- Lightning signatures escalate faster here, signaling tornadic potential before radar confirms rotation.
- Satellite data becomes your primary tool where radar gaps leave dangerous blind spots.
You’re maneuvering through compressed decision windows with degraded situational awareness. Understanding these regional atmospheric behaviors isn’t optional—it’s what keeps you mobile, informed, and ahead of storms that don’t follow conventional patterns.
Frequently Asked Questions
What Personal Safety Gear Do Storm Chasers Wear During Active Chases?
Protective padding, polarized eyewear, and reinforced helmets keep you safe. You’ll carry weather monitoring devices and emergency supplies, ensuring you’re analytically equipped to track dangerous data while maintaining freedom to maneuver through volatile, violent storm environments effectively.
How Do Storm Chasers Legally Access Private Land During Severe Weather Events?
You’ll need landowner permissions before accessing private land, as ethical considerations demand respectful communication. Always identify yourself, explain your mission’s safety value, and secure verbal or written consent to maintain legal compliance during severe weather chases.
What Mental Health Challenges Do Professional Storm Chasers Commonly Experience?
Over 60% of storm chasers report anxiety symptoms. You’ll face intense psychological pressure requiring strong emotional resilience and stress management skills. Witnessing destruction, near-miss incidents, and constant high-stakes decision-making challenge your mental fortitude, demanding deliberate psychological coping strategies.
How Much Does It Typically Cost to Fund a Storm Chasing Operation?
You’ll typically spend $5,000–$20,000 per season covering operational expenses like fuel, equipment, and insurance. Diversify your funding sources through grants, sponsorships, and data-selling partnerships to sustain financially independent, analytically rigorous storm chasing operations effectively.
Do Storm Chasers Require Official Meteorological Certifications Before Pursuing Storms Professionally?
You don’t need official certifications to chase storms professionally, but you’ll benefit from mastering meteorological data analysis. Upholding storm chasing ethics and understanding certification requirements strengthens your credibility, safety, and contribution to severe weather science.
References
- https://environment.leeds.ac.uk/icas-research-impact/doc/storm-chasers-making-life-saving-forecasts
- https://en.wikipedia.org/wiki/Storm_chasing
- https://www.stormchasingusa.com/blog/learning-the-basics-about-tornadic-storm-forecasting/
- https://www.depts.ttu.edu/research/discoveries/posts/Spring-2017/vortex.php