The best tools for predicting severe weather formations include Doppler radar, weather satellites, numerical models like ECMWF and HRRR, supercomputers, and weather balloons. You’ll also rely on Skew-T and hodograph analysis, AI-assisted detection systems, ensemble forecasting, data assimilation platforms, and integrated monitoring architectures. No single tool gives you the full picture—it’s the combination that sharpens warning lead times and reduces forecast uncertainty. Each tool’s true capability becomes clear when you examine how professionals deploy them together.
Key Takeaways
- Doppler radar detects storm rotation, wind velocity, and precipitation in real time, providing critical early warnings minutes before tornado formation.
- Weather satellites deliver continuous visible, infrared, and microwave imagery, extending storm monitoring to remote oceans, mountains, and vast geographic regions.
- Numerical models like ECMWF and HRRR simulate storm development by assimilating radar, satellite, and surface observation data simultaneously.
- Skew-T diagrams and hodographs analyze atmospheric instability, moisture depth, wind shear, and mesocyclone rotation potential for severe weather assessment.
- AI-powered predictive analytics process multi-source atmospheric data simultaneously, improving storm detection accuracy and sharpening severe weather warning systems.
Doppler Radar: The Gold Standard for Storm Detection
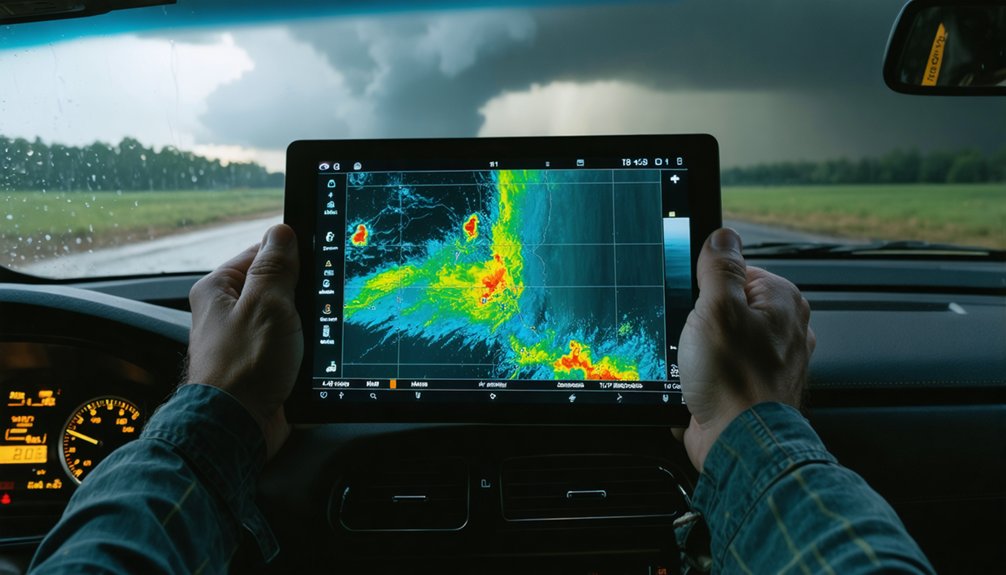
When it comes to real-time storm detection, Doppler radar stands as the most operationally critical tool in a forecaster’s arsenal. Its Doppler accuracy allows you to analyze precipitation analysis layers, track storm rotation, and perform wind profiling across multiple atmospheric levels simultaneously.
You’re detecting velocity fields that reveal mesocyclone development before a tornado touches down, giving you actionable intelligence within minutes. Detection technology updates rapidly, supporting operational forecasting workflows where timing directly impacts public safety.
Velocity fields expose mesocyclone development minutes before tornadoes form — turning radar data into life-saving operational intelligence.
Storm tracking across county-scale regions becomes precise and reliable. However, radar limitations exist — beam blockage, range degradation, and low-altitude blind spots reduce coverage in complex terrain.
That’s why data integration with satellite feeds and numerical models strengthens your severe weather analysis, compensating where radar alone can’t provide complete atmospheric situational awareness.
Weather Satellites That Track Severe Storms From Space
Doppler radar gives you unmatched precision at close range, but its coverage ends where terrain intervenes and its beam can’t reach over the horizon.
That’s where satellite observations become indispensable. Weather satellites monitor atmospheric systems continuously from geostationary and polar orbits, delivering visible, infrared, and microwave imagery across vast domains.
You gain situational awareness over oceans, mountain ranges, and remote regions where ground-based instruments simply can’t operate. Storm tracking at this scale lets you identify hurricane formation, mesoscale convective complexes, and large-scale moisture transport long before land-based sensors detect anything.
Modern satellites update imagery rapidly, giving you near-real-time cloud structure analysis. They don’t replace radar, but they extend your observational reach to planetary scales, ensuring no significant weather system develops outside your detection capability.
The Best Numerical Weather Prediction Models for Severe Weather
When forecasting severe weather, you’ll find that models like ECMWF and HRRR represent the strongest operational tools available, each optimized for different forecast timescales and storm scenarios.
These systems ingest radar, satellite, and surface observations through data assimilation, then solve atmospheric equations across fine spatial grids to simulate storm development, precipitation, and wind behavior.
You can sharpen their output further by running ensemble configurations and applying advanced numerical algorithms that reduce error propagation across the forecast cycle.
Top Performing Prediction Models
Numerical weather prediction (NWP) models are the computational backbone of severe weather forecasting, translating atmospheric observations into actionable guidance.
When you’re evaluating storm modeling capability, two systems stand out. The ECMWF delivers exceptional global forecast accuracy through high-resolution output and sophisticated data assimilation, making it the benchmark for extended-range predictive analytics.
The HRRR excels at short-range applications, updating hourly to capture rapidly evolving convection, fog, and severe thunderstorm development.
Both models ingest radar, satellite, and surface observations continuously, refining atmospheric simulations as conditions change.
You’ll get the most reliable situational awareness by cross-referencing both systems rather than relying on a single output.
Understanding each model’s strengths lets you apply the right tool to the right threat window with precision.
How Models Forecast Storms
Forecasting severe weather through numerical models begins with data assimilation, where observational inputs from radar, satellites, weather balloons, and surface stations get ingested into the model’s initial atmospheric state. This storm initialization process anchors weather simulations to real atmospheric dynamics, reducing forecast uncertainty from the start.
Once initialized, models apply governing equations of motion, thermodynamics, and moisture transport to project how storm systems evolve. Ensemble forecasting runs multiple simulations with varied initial conditions, exposing the full range of possible outcomes. Predictive analytics then quantify probability distributions across those runs.
Model calibration and model validation compare outputs against observed events, sharpening future performance. You gain more reliable storm prediction when these systems continuously assimilate fresh data, keeping simulations tightly coupled to rapidly changing atmospheric conditions.
Improving Model Forecast Accuracy
Model forecast accuracy improves through a combination of data assimilation quality, spatial resolution, and computational power behind each simulation.
You gain sharper, more reliable severe weather predictions when forecasters apply these proven techniques:
- Ensemble forecasting methods — Running multiple model simulations simultaneously reveals the range of possible outcomes, quantifying uncertainty before a storm develops.
- Model validation techniques — Comparing past forecast outputs against actual observed conditions exposes systematic errors, allowing modelers to correct biases before they compound.
- High-resolution data assimilation — Ingesting real-time radar, satellite, and upper-air sounding data into active simulations tightens the model’s grip on rapidly evolving storm environments.
Each refinement compounds.
Better inputs, honest validation, and disciplined ensemble interpretation give you the clearest possible picture of incoming severe weather threats.
How Supercomputers Power Severe Weather Forecasts

Behind every severe weather forecast lies an enormous computational effort that most users never see. Supercomputer advancements have fundamentally transformed how meteorologists process atmospheric data, running complex atmospheric simulations across millions of grid points within minutes. You benefit directly from these computational capabilities whenever agencies issue timely tornado or hurricane warnings.
Modern supercomputers drive data processing efficiency by rapidly ingesting radar, satellite, and sounding observations into live forecast systems. Modeling innovations like ensemble runs and high-resolution storm tracking allow predictive analytics to evaluate dozens of atmospheric scenarios simultaneously.
Modern supercomputers rapidly process radar, satellite, and sounding data, evaluating dozens of atmospheric scenarios simultaneously through ensemble modeling.
Forecast reliability depends entirely on how quickly these machines execute calculations before conditions evolve. Without sustained investment in computational capabilities, forecast accuracy would stagnate.
Supercomputers fundamentally give you the freedom to act on precise, timely information rather than reacting blindly to dangerous weather.
Weather Balloons and What They Reveal About Storm Potential
While supercomputers process vast datasets at remarkable speed, the raw observational data feeding those systems must come from somewhere. Weather balloons deliver critical atmospheric profiles that sharpen predictive accuracy across forecasting techniques. They measure environmental conditions that radar and satellites simply can’t replicate at vertical resolution.
Each balloon ascent reveals:
- Temperature gradients and moisture levels — exposing instability layers where convective storm dynamics develop explosively.
- Wind patterns at multiple altitudes — identifying wind shear configurations that determine whether rotating supercells can organize.
- Pressure and humidity data — enabling stability analysis that distinguishes ordinary thunderstorm environments from catastrophic outbreak setups.
You can’t substitute this direct data collection with remote sensing alone. These vertical snapshots of atmospheric conditions remain foundational inputs that drive model accuracy when severe weather threatens.
What Skew-T and Hodograph Charts Reveal About Severe Weather Potential
When you analyze a Skew-T log-P diagram, you’re reading temperature, dewpoint, and wind profiles plotted against atmospheric pressure to assess instability, moisture depth, and convective potential.
You’ll use indices like CAPE, CIN, and the lifted index to determine whether the atmosphere supports storm development and how explosive that growth might be.
Pair that analysis with a hodograph—a vector plot of wind speed and direction through the atmospheric column—and you can evaluate the directional wind shear that drives storm rotation and supercell organization.
Reading Skew-T Charts
Skew-T log-P diagrams and hodographs give forecasters a direct read on the atmospheric conditions that drive severe weather. Skew-T analysis layers temperature, dewpoint, and wind data onto a single chart, letting you decode atmospheric stability, moisture profiling, and storm development potential instantly.
- Temperature curves reveal temperature inversion layers where warm air traps cool, unstable air beneath — a critical precursor to explosive convection.
- Dewpoint profiles expose moisture depth, showing you exactly where atmospheric moisture fuels storm development.
- Wind barbs display shifting wind patterns across altitude, exposing directional shear that controls storm rotation and intensity.
Mastering data interpretation from these charts sharpens your forecasting techniques, giving you independent analytical power to assess severe weather threats before models confirm them.
Hodograph Wind Shear Analysis
Hodographs translate raw wind data into a diagnostic map of storm rotation potential, giving you a visual shortcut that Skew-T charts alone can’t provide. By plotting wind vectors at successive atmospheric levels, hodograph interpretation reveals how wind speed and direction change with height.
That curvature and length quantify wind shear dynamics directly—a tightly curved, elongated hodograph signals strong rotational energy available for supercell development.
You’re reading storm-relative helicity when you calculate the area swept within a hodograph’s curve. Larger swept areas correlate with stronger mesocyclone potential and elevated tornado probability.
Short, straight hodographs suggest squall lines or multicell clusters instead. Combined with instability data from your Skew-T analysis, hodographs sharpen your severe weather assessment, transforming abstract wind profiles into actionable forecasting intelligence before conditions deteriorate.
AI Tools Changing How We Predict Severe Weather
As forecasting demands grow more complex, AI and machine learning are reshaping how meteorologists detect, analyze, and predict severe weather.
These AI advancements drive smarter storm modeling, faster automated detection, and tighter data integration across radar, satellite, and upper-air sources. Algorithm improvements continuously refine severe event prediction, giving you more accurate, earlier warnings.
AI drives smarter storm modeling, faster detection, and sharper warnings through continuous algorithm refinement.
Three capabilities define this shift in weather forecasting:
- Automated storm-feature recognition scans satellite imagery in under a minute, identifying dangerous cloud structures with nearly 100% accuracy.
- Predictive analytics engines process multi-source atmospheric data simultaneously, flagging severe weather setups before traditional methods catch them.
- Machine learning feedback loops refine future technologies by learning from past forecast errors, steadily sharpening hurricane track and intensity models.
Short-Range vs. Long-Range Severe Weather Forecasting Tools
Forecasting tools don’t operate on a single timeline—short-range and long-range systems serve distinct roles, each suited to different stages of severe weather anticipation.
For short range forecasting, you’ll rely on Doppler radar and HRRR models, which deliver rapid storm tracking, feature recognition, and high predictive accuracy within 0–48 hours. These systems ingest real-time data assimilation cycles, capturing fast-evolving atmospheric dynamics that longer-range tools miss.
For long range forecasting, you shift toward model ensembles like ECMWF, which synthesize broader atmospheric dynamics across 7–15 day windows. These tools sacrifice some resolution for probabilistic range, giving you statistical guidance rather than pinpoint storm tracking.
Understanding which tool fits which timeline lets you act strategically—whether you’re making decisions hours out or planning days ahead.
How Radar, Satellites, and Models Combine During Severe Outbreaks
When a severe weather outbreak unfolds, you’re relying on a layered system where Doppler radar, geostationary satellites, and numerical models each feed critical data into a unified operational picture.
Radar captures storm-scale rotation and precipitation structure in near real time, while satellites track the broader mesoscale environment and identify convective initiation over gaps in radar coverage.
You then use model guidance to interpret how atmospheric instability, wind shear, and moisture flux will drive storm evolution over the next several hours, allowing forecasters to issue targeted, timely warnings.
Integrated Severe Weather Monitoring
During a severe weather outbreak, no single tool operates in isolation—radar, satellites, and numerical models work together as an integrated observational system.
Each layer of integrated monitoring sharpens your situational awareness when severe weather threatens:
- Radar reveals real-time rotation, precipitation cores, and storm-relative wind fields at mesoscale resolution.
- Satellites capture the broader convective structure, tracking explosive cloud-top growth and storm organization across regional scales.
- Numerical models synthesize both data streams, generating probabilistic forecasts that project storm evolution hours ahead.
Together, these tools eliminate blind spots no single instrument can cover alone.
You’re not relying on guesswork—you’re operating within a disciplined, data-driven framework that converts raw atmospheric signals into actionable, precise severe weather intelligence.
Real-Time Data Fusion
Real-time data fusion is what transforms disconnected atmospheric observations into a coherent, actionable severe weather picture. When you’re tracking a severe outbreak, Doppler radar, weather satellites, upper-air soundings, and numerical model output don’t operate in isolation — they converge.
Real-time integration of these streams allows forecasters to cross-validate signals: radar detects rotation while satellite confirms storm-top divergence and model soundings expose shear profiles beneath. That convergence eliminates blind spots no single tool can cover alone.
Effective data visualization makes this fusion operationally useful. You’re able to layer radar reflectivity over satellite-derived moisture fields and model-predicted instability indices simultaneously, revealing threat corridors with precision.
Without this integration architecture, severe weather warnings arrive slower, with less certainty — costing exactly the freedom and preparation time you need to act.
How Professional Forecasters Choose and Combine These Tools
Professional forecasters don’t rely on a single tool—they integrate multiple data streams based on the weather scenario, lead time, and available resources.
Effective tool integration and collaboration strategies sharpen forecast accuracy when conditions evolve rapidly.
When the atmosphere shifts fast, integrated tools and sharp collaboration don’t just help—they define forecast accuracy.
Here’s how they combine resources decisively:
- Short-term convective threats: Forecasters cross-reference HRRR model output with live Doppler radar loops and upper-air soundings to pinpoint storm initiation timing and rotation potential.
- Hurricane tracking: Satellite imagery establishes structural evolution while ECMWF model ensembles define track probability corridors, giving you a clearer picture of landfall risk.
- Tornado outbreak environments: Hodograph analysis from balloon soundings reveals wind shear profiles, while AI-assisted radar tools flag rotation signatures faster than manual review allows.
Each tool fills a specific gap—none operates effectively in isolation.
Frequently Asked Questions
Can Severe Weather Prediction Tools Be Accessed by the General Public?
Yes, you can access severe weather prediction tools through public accessibility platforms like Weather.gov and Ventusky, which feature user-friendly interfaces that let you monitor radar, satellite imagery, and forecast models independently.
How Accurate Are Severe Weather Predictions Compared to Historical Forecasting Methods?
You’re ahead of the curve—modern forecasting techniques dramatically outperform historical accuracy. AI, Doppler radar, and NWP models now predict severe weather with precision that older barometric and observational methods simply couldn’t match, giving you far greater warning lead times.
What Certifications Do Professional Meteorologists Need to Use These Forecasting Tools?
You’ll need a meteorology education and AMS or NWA certification requirements to professionally operate forecasting tools. These credentials validate your technical competency in radar interpretation, numerical modeling, and atmospheric analysis for severe weather prediction workflows.
How Do Severe Weather Prediction Tools Perform in Polar or Extreme Environments?
You’ll find polar forecasting challenging, as extreme environments limit radar coverage and balloon launches. Satellites become your primary tool, while NWP models struggle with sparse data, reducing prediction accuracy in these remote, unmonitored regions.
Are There Open-Source Alternatives to Professional Severe Weather Prediction Software?
Over 500 developers contribute to open-source software like MetPy and SHARPpy, giving you free access to sounding analysis and storm diagnostics. Community contributions continuously expand these tools, letting you predict severe weather independently.
References
- https://www.discovery.com/science/ai-tools-help-to-predict-extreme-weather
- https://www.spatialpost.com/what-tools-do-meteorologists-use/
- https://www.youtube.com/watch?v=rmTiSapVKlE
- https://www.youtube.com/watch?v=yz4PXhKXBzo
- https://www.youtube.com/watch?v=l0nbGzm5TUE
- https://climavision.com/resources/the-ultimate-guide-to-weather-forecast-models/
- https://tempest.earth/resources/weather-forecasting-tools/
- https://www.rikasensor.com/a-15-weather-prediction-tools-and-innovations-that-shaped-our-understanding-of-weather-forecasting.html
- https://www.noaa.gov/stories/6-tools-our-meteorologists-use-to-forecast-weather
- https://www.abc10.com/article/weather/new-tool-to-track-violent-storm-threats/507-59551570-8b9a-43cd-8f8a-1adfa4842165