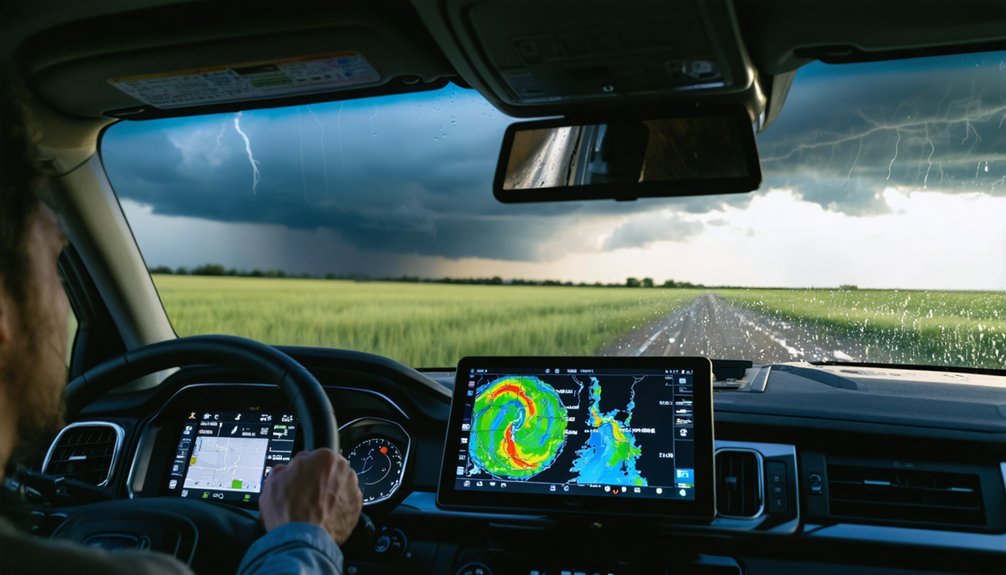
When you’re tracking storms in real time, you need tools that deliver fast, accurate data. RadarScope gives you NEXRAD Level 3 data with velocity and dual-polarization products. The National Hurricane Center provides authoritative surge and wind forecasts every six hours. Platforms like RadarOmega, WeatherBug, and SPC NOAA add lightning detection, convective outlooks, and mesocyclone analysis. Pair these with mobile weather stations and satellite imagery for complete situational awareness. The right combination of tools makes all the difference—and there’s much more to unpack about each one.
Key Takeaways
- RadarScope provides real-time NEXRAD Level 3 data, offering storm chasers professional-grade radar tools for precise field decision-making.
- NEXRAD dual-polarization radar detects rain, hail, debris, and wind shear, enabling accurate storm core analysis.
- Geostationary satellites deliver continuous wide-area storm imagery, essential for monitoring offshore development before NEXRAD range coverage.
- RadarOmega identifies mesocyclone strength, hook echoes, and reflectivity gradients using dual-polarization, multi-tilt radar sweeps.
- WeatherBug provides instant lightning strike detection with customizable thresholds, signaling storm escalation before radar shows organized cores.
RadarScope: The Go-To App for Serious Storm Chasers
When it comes to serious storm chasing, RadarScope stands out as the top mobile radar app for both iOS and Android. You’ll access real-time NEXRAD Level 3 data, giving you precise velocity readings, precipitation rates, and storm intensity metrics that casual weather apps simply can’t match.
Radar calibration accuracy matters when you’re tracking a rotating supercell, and RadarScope delivers the technical resolution you need to make fast, informed decisions.
You can overlay multiple data products simultaneously, letting you analyze wind shear, reflectivity, and storm structure without switching platforms.
Whether you’re in the field or monitoring remotely, you’re getting professional-grade radar tools in your pocket.
For anyone serious about real-time storm monitoring, RadarScope isn’t optional — it’s essential.
National Hurricane Center Data: Your Authoritative Source for Live Hurricane Tracking
For live hurricane tracking, the National Hurricane Center is your definitive data source — covering storm surge projections, current wind speeds, arrival time predictions, and precise storm location. You’ll access authoritative forecasts updated every six hours, giving you actionable data when conditions shift rapidly.
Storm surge modeling from the NHC lets you assess inundation risk before landfall, helping you make independent decisions about evacuation or shelter. Coastal erosion accelerates dramatically during surge events, so understanding surge forecasts means you’re not reacting blindly to deteriorating conditions.
Pair NHC data with NOAA feeds and SPC alerts to build a comprehensive operational picture. You’re not dependent on secondhand interpretations — you’re working directly from the most technically rigorous hurricane intelligence available, preserving your ability to act decisively on verified information.
How NEXRAD and Doppler Radar Pinpoint Storms in Real Time
While NHC data tells you where a hurricane is and where it’s heading, NEXRAD and Doppler radar tell you what’s happening inside the storm right now. NEXRAD’s nationwide network delivers real-time velocity and precipitation data, letting you detect rotation, wind shear, and rainfall intensity at the storm’s core.
Dual polarization enhances that capability profoundly. By transmitting both horizontal and vertical pulses, dual-pol radar distinguishes rain from hail, debris, and mixed precipitation—giving you sharper storm structure data than single-pol systems ever could.
Radar calibration keeps those readings accurate. Without consistent calibration, velocity and reflectivity measurements drift, undermining your situational awareness when it matters most. You need reliable, precise data to make sound decisions—and properly maintained NEXRAD systems deliver exactly that, independent of official forecast dependency.
Satellite Imagery Tools for Offshore and Pre-Landfall Storm Tracking
When storms develop far offshore, you can’t rely on land-based Doppler radar alone—geostationary satellites fill that gap by providing continuous, wide-area observation of storm structure, cloud motion, and intensification trends.
You’ll use these systems to analyze a hurricane’s banding features, eye formation, and convective organization well before it enters NEXRAD range.
That pre-landfall data gives you a critical lead time advantage, letting you correlate satellite-derived intensity estimates with NHC forecast models before the storm makes its final approach.
Geostationary Satellite Coverage Benefits
Geostationary satellites orbit at approximately 35,786 km above Earth’s equator, maintaining a fixed position relative to the surface and delivering continuous, wide-area imagery of storm systems that ground-based radar simply can’t reach.
You gain uninterrupted visual access to cloud cover patterns, allowing you to track rotational structure, convective development, and storm organization across vast oceanic expanses.
Because these satellites hold their position, you’re not waiting for orbital passes—data refreshes at rapid intervals, giving you near real-time situational awareness.
You can also correlate satellite imagery with atmospheric pressure readings to assess intensification trends before landfall.
When storms push beyond NEXRAD’s effective range, geostationary coverage fills that critical monitoring gap, ensuring you’re never operating blind during a storm’s most dangerous developmental phases.
Offshore Storm Structure Analysis
Satellite imagery tools give you direct visibility into offshore storm structure long before a system threatens coastlines. By analyzing high-resolution geostationary feeds, you can assess convective organization, eye-wall symmetry, and banding structure in real time.
Four critical offshore analysis factors include:
- Ocean temperature mapping — identifies warm-core fuel sources that intensify storm development
- Underwater currents tracking — reveals upwelling zones that can rapidly weaken or strengthen systems
- Cloud-top temperature gradients — measures convective intensity through infrared satellite channels
- Rapid intensification signatures — detects sudden pressure drops before official advisories confirm them
Cross-referencing satellite overlays with NOAA data feeds and National Hurricane Center advisories sharpens your situational awareness. You’re not waiting on filtered reports — you’re reading raw atmospheric behavior directly.
RadarOmega for Advanced Radar Analysis and Storm Structure Interpretation
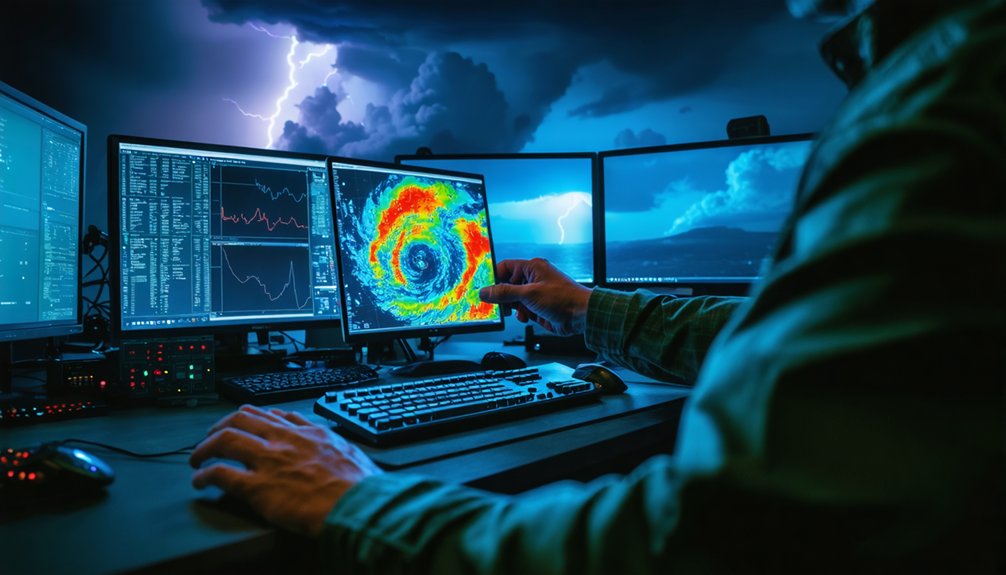
When you need more than basic radar overlays, RadarOmega gives you access to advanced dual-polarization data, multi-tilt radar sweeps, and velocity products that expose storm-scale rotation with precision.
You can use its real-time storm structure tools to assess mesocyclone strength, identify hook echoes, and monitor reflectivity gradients as a storm evolves.
Its data-driven interface lets you move beyond surface-level interpretation and make faster, better-informed decisions during rapidly developing severe weather events.
Advanced Radar Analysis Features
For storm chasers and meteorologists who need deeper storm structure interpretation, RadarOmega delivers advanced radar analysis tools that go well beyond standard mobile radar apps. Its radar signal processing engine extracts granular data, giving you sharper situational awareness when storms escalate rapidly.
Key advanced features include:
- Dual-polarization analysis — distinguishes precipitation types and debris signatures within rotating mesocyclones
- Storm intensity metrics — quantifies rotation strength, reflectivity gradients, and shear values in real time
- Velocity azimuth display (VAD) — profiles wind speed and direction at multiple atmospheric levels
- Multi-tilt composite views — layers radar sweeps across elevation angles for complete vertical storm structure
These capabilities let you make independent, data-driven decisions without depending solely on filtered official summaries.
Real-Time Storm Structure Interpretation
RadarOmega’s real-time storm structure interpretation puts raw dual-pol and velocity data directly in your hands, letting you analyze a storm’s internal mechanics as they evolve. You’re not waiting on filtered summaries—you’re reading correlation coefficient fields, differential reflectivity, and rotational couplets the moment they update.
Track atmospheric shear gradients across tilt angles to identify mesocyclone development before official warnings issue. Monitor cloud formation patterns through base reflectivity and echo tops simultaneously, giving you a three-dimensional picture of convective growth.
Velocity azimuth display products let you assess wind profiles independently, bypassing institutional delays. RadarOmega’s layered data architecture means you control which parameters you interrogate and when. That autonomy translates directly into faster, better-informed decisions during rapidly evolving severe weather events.
MyRadar and Clime: Radar Overlays and Severe Weather Alerts for Everyday Users
Each platform gives you layered storm awareness through:
- Live NEXRAD radar overlays displaying precipitation intensity and movement.
- Severe-weather alerts triggered by NWS-issued warnings for your exact location.
- Storm overlays combining radar and satellite imagery for full situational context.
- Custom notifications that track developing threats before they reach your area.
Clime adds detailed weather maps, while MyRadar prioritizes speed and simplicity.
You don’t need meteorological training to interpret either interface—just a need for accurate, real-time storm data on demand.
Mobile Weather Stations for Measuring Wind Speed and Local Flood Risk
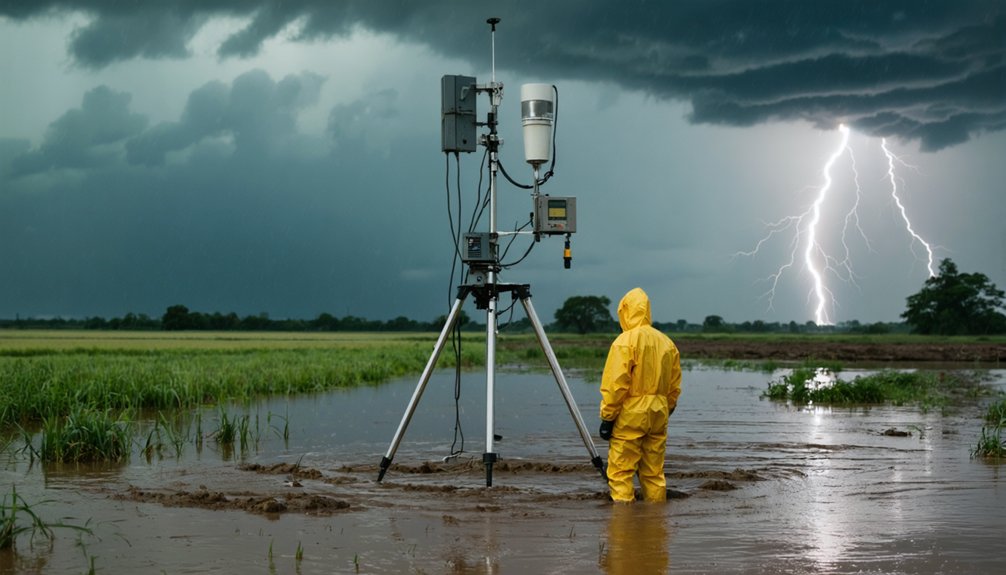
While apps deliver radar and satellite data remotely, mobile weather stations put ground-level measurement directly in your hands. You deploy anemometers and integrated sensors to capture real-time wind speed, humidity, and temperature—data no remote radar can replicate at your exact location.
Wind sensor deployment lets you position measurement points where exposure matters most: open ridgelines, coastal edges, or flood-prone corridors. You’re not relying on interpolated regional readings; you’re capturing hyperlocal conditions as they shift.
For flood risk analysis, pairing rain gauges with mobile stations gives you cumulative precipitation totals that directly inform drainage and evacuation decisions. When you combine that ground-truth data with NEXRAD radar overlays and NWS warnings, you build a complete, independent picture of incoming storm intensity and local impact.
Lightning Detection Systems That Signal a Developing Storm Core
Ground-level sensors capture what’s directly above you, but lightning detection networks extend your awareness outward, flagging the earliest signs of storm escalation before radar shows a fully organized core. Lightning strike patterns reveal storm core dynamics in real time, giving you actionable data before conditions deteriorate.
Lightning detection networks extend your awareness outward, flagging storm escalation before radar reveals a fully organized core.
Track these four escalation indicators:
- Strike rate acceleration — rapid increases in strikes per minute signal intensifying convection
- Spatial clustering — tightening strike geometry indicates a consolidating storm core
- Polarity shifts — positive lightning dominance often precedes severe weather transitions
- Outward propagation — strikes expanding from a central zone confirm organizational growth
Apps like WeatherBug integrate live lightning feeds directly into your monitoring workflow. Cross-reference strike data with NEXRAD radar and NWS warnings to confirm whether escalation warrants immediate action.
WeatherBug and SPC NOAA for Real-Time Severe Weather Alerts
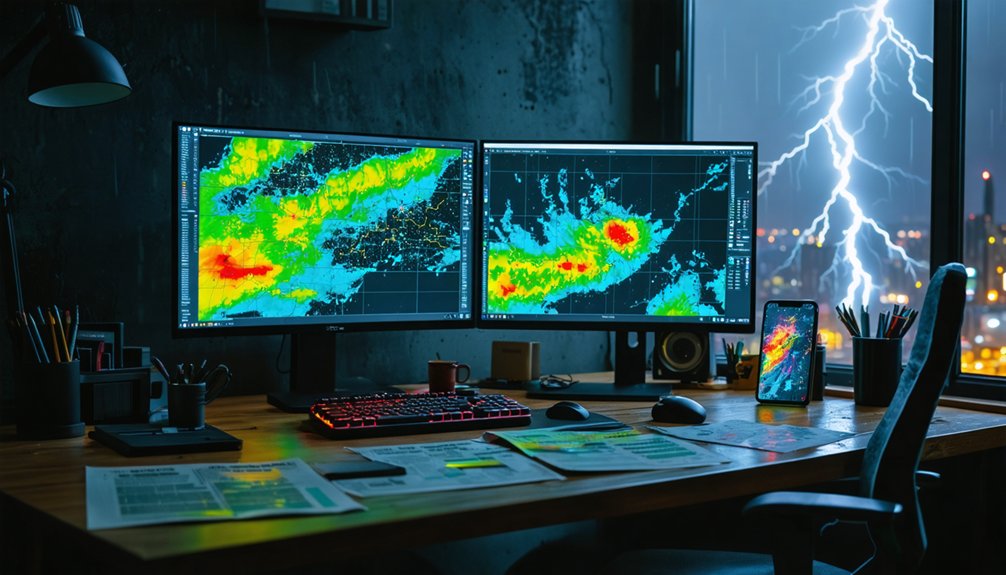
When you need real-time severe weather alerts, WeatherBug delivers immediate lightning strike notifications tied to your exact location, letting you track storm escalation as convection intensifies.
You can use SPC NOAA’s forecast tools to access convective outlooks, mesoscale discussions, and storm prediction data that pinpoint risk areas hours before conditions deteriorate.
Together, these platforms give you a data-rich alerting layer that bridges ground-level lightning detection with official probabilistic forecasts.
WeatherBug Lightning Alert Features
For real-time severe weather alerting, WeatherBug and SPC NOAA serve distinct but complementary roles. WeatherBug’s lightning alert features give you precise, location-based strike notifications the moment activity begins.
You’ll benefit from:
- Instant lightning strikes detection within a defined radius of your location
- Alert customization letting you set distance thresholds and notification intensity
- Strike frequency data helping you assess whether convection is escalating or weakening
- Geographic mapping displaying real-time strike coordinates against radar overlays
These features let you make independent, data-driven decisions without waiting for official broadcasts.
Alert customization means you’re not overwhelmed by irrelevant notifications—only threats within your defined parameters trigger warnings. Combined with radar data, WeatherBug’s lightning monitoring gives you actionable situational awareness during rapidly developing storm events.
SPC NOAA Forecast Tools
SPC NOAA’s forecast tools complement WeatherBug’s real-time strike data by shifting your focus from immediate lightning activity to broader severe-weather probability. You can access convective outlooks, mesoscale discussions, and storm surge projections that extend your situational awareness beyond localized lightning detection.
SPC’s probabilistic threat maps integrate climate modeling data, letting you assess storm intensity trajectories hours before conditions deteriorate. You’re no longer reacting—you’re anticipating.
The platform categorizes severe-weather risk across defined geographic zones, giving you precise threat gradients rather than generalized warnings. Storm surge forecasts embedded within SPC’s data pipeline help coastal users quantify inundation risk tied to advancing systems.
Combined with WeatherBug’s strike alerts, SPC NOAA transforms your monitoring strategy from reactive point-source detection into a structured, data-driven decision framework built for real independence.
My Hurricane Tracker for Comparing Active Storms Against Historical Data
My Hurricane Tracker gives you direct access to historical storm archives dating back to 1851 in the Atlantic and 1949 in the Pacific, letting you benchmark active systems against decades of recorded data. You can cross-reference historical patterns and climate trends to make sharper, faster decisions during active events.
Use the tool to:
- Compare current storm intensity against similar historical systems by region and season
- Identify climate trends revealing how storm tracks have shifted over time
- Evaluate peak wind speeds, pressure readings, and landfall zones from past hurricanes
- Overlay historical data onto active forecasts for precise trajectory analysis
This data-driven approach strips away guesswork, giving you independent analytical capability without relying solely on agency interpretations.
Frequently Asked Questions
Can Storm Monitoring Tools Work Effectively Without an Internet Connection?
Picture dark skies closing in—you’re cut off. Most storm monitoring tools can’t deliver emergency alerts without connectivity. Offline functionality is limited; you’ll lose live radar, NEXRAD feeds, and real-time satellite data instantly.
How Accurate Are Real-Time Storm Predictions Compared to Actual Storm Behavior?
Storm prediction accuracy varies considerably—you’ll find models perform well 24–48 hours out, but weather modeling limitations compound beyond 72 hours, causing track and intensity deviations that real-time NEXRAD, satellite data, and NWS updates help you continuously correct.
Are These Storm Monitoring Tools Accessible for Users With Disabilities?
These tools have accessibility features that’ll move mountains for you. You’ll find user interface design varies widely—RadarScope, MyRadar, and WeatherBug support screen readers and adjustable contrast, empowering you to monitor storms independently and freely.
What Is the Average Cost of Using Professional Storm Monitoring Tools?
You’ll find professional storm monitoring tools range from free to $100+ annually. Weather radar apps like RadarScope cost ~$10, while advanced platforms with data encryption and enterprise features can exceed $500 yearly.
How Do Storm Monitoring Tools Handle Data Privacy and User Location Information?
Storm monitoring tools protect your location through data encryption and clearly defined privacy policies. You’re in control—review each app’s settings, limit data sharing permissions, and guarantee you’re only granting location access when actively tracking storms.
References
- https://play.google.com/store/apps/details?id=weatherradar.livemaps.free&hl=en_US
- https://www.radaromega.com/
- https://myradar.com/
- https://teamrubiconusa.org/news-and-stories/best-hurricane-tracking-apps-and-tools/
- https://crazystormchasers.com/real-time-storm-monitoring-challenges/
- https://www.weatherwise.app/
- https://the-weather.com/top-10-weather-apps-for-tracking-extreme-weather-in-2025/
- https://www.reddit.com/r/weather/comments/1kdate2/what_are_your_goto_websites_for_tracking_an/
- https://crazystormchasers.com/top-storm-monitoring-software-for-storm-chasers/