Remote sensing has completely transformed how you study hurricanes, replacing scattered ship logs and rare aircraft sorties with continuous, multi-sensor networks spanning entire ocean basins. You now leverage geostationary satellites, Doppler radar, LiDAR, and reconnaissance aircraft together to track storm intensity, map structural damage, and assess coastal morphology changes in real time. Each sensor fills gaps the others leave behind, though critical limitations in spatial resolution and temporal coverage still persist—and understanding exactly where those gaps fall changes everything about how you interpret the data.
Key Takeaways
- Remote sensing integrates satellite imagery, Doppler radar, and reconnaissance aircraft to provide continuous, multi-sensor hurricane tracking and intensity measurement.
- Weather satellites have monitored storm development since the 1960s, capturing cloud-top temperatures, moisture distribution, and eyewall structure in real time.
- LiDAR and aerial imagery enable precise post-hurricane damage assessment by revealing elevation changes, overwash patterns, and structural losses.
- Multi-sensor data fusion cross-validates intensity estimates, reduces forecast uncertainty, and improves evacuation and emergency response decision-making.
- Remote sensing faces limitations including spatial precision gaps, temporal resolution constraints, and persistent data challenges regarding localized hurricane impacts.
Why Satellites and Sensors Transformed Hurricane Research
Before satellites entered the picture, researchers tracking hurricanes over open ocean relied on sparse ship reports and the rare aircraft observation—data that left enormous spatial gaps and delayed warnings by hours.
Technological advancements changed that completely. You now have continuous, multi-sensor coverage that sharpens data accuracy across storm prediction and hurricane forecasting cycles.
Remote sensing integrates satellite imagery, Doppler radar, and reconnaissance aircraft into layered analysis techniques that weren’t previously possible. Each platform addresses specific sensor limitations—no single tool captures everything.
Environmental impact assessments and recovery planning both depend on this collaborative data architecture, where research collaboration across agencies drives better models.
You’re working with systems that compress reaction time, expand spatial coverage, and deliver actionable intelligence when it matters most.
How Remote Sensing Satellites Track Storms in Real Time
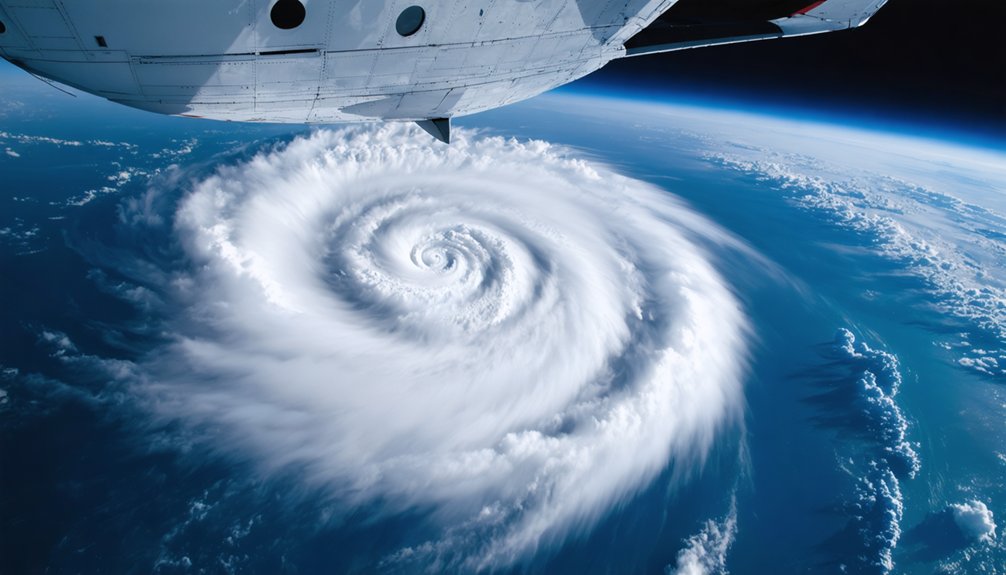
When you track a hurricane in real time, you’re drawing on a layered system of weather satellites that have monitored storm development over open ocean since the 1960s, using sequential imagery to estimate surface tracks and detect organizational changes.
You can sharpen intensity analysis further by applying advanced satellite-based methods that derive central sea-level pressure from eyewall cloud-altitude and temperature data—metrics that standard remote-sensing approaches can’t resolve alone.
Integrating Doppler radar, reconnaissance aircraft, and multi-satellite feeds into a single operational framework gives you the most complete, data-rich picture of a storm’s current state and near-term trajectory.
Satellite Storm Monitoring Basics
Since the 1960s, weather satellites have formed the backbone of tropical cyclone monitoring, giving forecasters continuous, wide-area coverage over ocean regions where ground-based instruments can’t reach. You can track storm evolution across entire ocean basins by analyzing sequential satellite imagery, extracting surface track estimates and structural changes as they develop in near real time.
Modern satellite technology integrates visible, infrared, and microwave sensors to capture cloud-top temperatures, eyewall structure, and moisture distribution simultaneously. These datasets let analysts estimate central sea-level pressure by correlating eyewall cloud altitude and temperature signatures, pushing intensity analysis beyond what standard optical imagery alone can deliver.
Combined with Doppler radar and reconnaissance aircraft data, satellite platforms give you a layered, multi-source picture that’s faster, safer, and far more scalable than any ground-based alternative.
Real-Time Intensity Measurement
Although reconnaissance aircraft remain the gold standard for direct intensity measurement, satellite platforms now deliver real-time intensity estimates by analyzing eyewall cloud-altitude and temperature data to derive central sea-level pressure. You can leverage these real-time updates to track rapid intensification cycles without waiting for aircraft deployment windows.
Intensity calibration bridges the gap between passive satellite observations and in-situ measurements, correcting for sensor drift and atmospheric interference to sharpen pressure estimates.
Geostationary platforms sample storm structure at high temporal frequency, giving you continuous data streams rather than periodic snapshots. When you integrate Doppler radar wind-field data alongside satellite-derived pressure profiles, the combined dataset strengthens intensity analysis considerably.
This multi-sensor approach reduces uncertainty, accelerating informed decisions about evacuation timing, resource pre-positioning, and emergency response coordination.
Multi-Sensor Tracking Integration
Three distinct sensor types converge in modern hurricane tracking systems: geostationary satellites, low-Earth orbit platforms, and airborne Doppler radar.
You’re working with fundamentally different data streams—continuous wide-area imagery, high-resolution polar passes, and direct wind-field measurements—each carrying unique temporal and spatial trade-offs.
Multi-sensor collaboration resolves those trade-offs by cross-validating intensity estimates, track position, and structural evolution simultaneously.
Geostationary feeds deliver continuous storm monitoring, while low-orbit passes sharpen resolution at critical intervals. Doppler radar then grounds both against measured wind vectors as the system approaches land.
Data fusion techniques synthesize these inputs into coherent, operationally actionable products.
Algorithms reconcile conflicting measurements, weight higher-confidence sources, and output refined track forecasts.
The result is a tracking architecture that’s faster, more accurate, and structurally more resilient than any single-sensor approach.
What Doppler Radar and Recon Aircraft Add to the Picture
Satellites give forecasters a broad view of storm structure, but they can’t measure what’s happening inside the eyewall or within rain bands with the precision that operational decision-making demands.
Doppler radar fills that gap by delivering real-time monitoring of wind profiling, rain band intensity, and precipitation totals as storms approach land. You get directional wind data and rainfall accumulation that satellites simply can’t resolve at that scale.
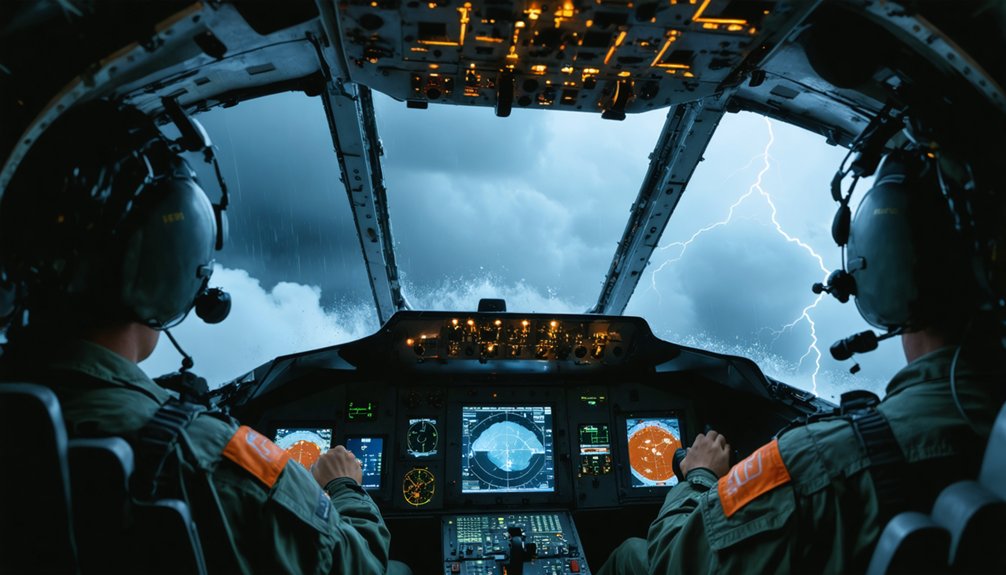
Reconnaissance aircraft push data accuracy further still, flying directly into storm cores to record central pressure, flight-level winds, and dropsonde profiles. That aerial support remains the most reliable method for determining storm intensity in U.S. operational zones.
Together, Doppler radar and recon aircraft give decision-makers ground-truth measurements that sharpen evacuation timing, resource deployment, and post-landfall damage assessment considerably.
How Remote Sensing Estimates Hurricane Intensity From Space
Radar and reconnaissance aircraft anchor the inner-core measurement problem, but space-based intensity estimation has advanced enough to warrant serious attention alongside those platforms.
You can now derive central sea-level pressure estimates by analyzing eyewall cloud-altitude and temperature data from satellite sensors—a remote sensing advancement that meaningfully extends your analytical reach beyond standard imagery.
The method links upper-level cloud temperatures to surface pressure gradients, giving you intensity indicators without requiring aircraft penetration. That matters when storms track through data-sparse oceanic regions where reconnaissance coverage thins.
Upper-level cloud temperatures reveal surface pressure gradients—delivering intensity indicators where reconnaissance aircraft simply cannot reach.
Hurricane intensity assessments built on these techniques still carry uncertainty, but calibrating satellite-derived estimates against aircraft measurements progressively sharpens their reliability.
As sensor resolution and retrieval algorithms improve, space-based intensity estimation will increasingly complement—and occasionally substitute for—direct in-situ observation.
How Aerial Imagery and LiDAR Mapped Hurricane Ian’s Damage
When Hurricane Ian made landfall on Southwest Florida’s barrier islands, the destruction it left on Estero Island demanded a damage assessment approach that field teams alone couldn’t efficiently deliver.
Florida Atlantic University researchers deployed aerial damage assessment workflows combining high-resolution aerial imagery with LiDAR applications to identify hardest-hit structures and quantify morphological shifts across the barrier island system.
Pre- and post-storm datasets revealed precise elevation changes, overwash patterns, and structural losses that ground surveys couldn’t capture at scale.
LiDAR applications provided detailed surface geometry, while aerial imagery contextualized inundation extent and building damage spatially. Together, they produced fine-scale damage maps prioritizing emergency response zones.
You can see why this multi-sensor approach matters: it’s faster, safer, and more scalable than traditional reconnaissance, and it’s generalizable to other hurricane-prone coastal regions.
How Satellite Imagery Predicts Where Storm Debris Will Block Roads
Predicting where storm debris will overwhelm road networks after a hurricane landfall is now achievable before cleanup crews deploy, thanks to satellite-based vegetation analysis.
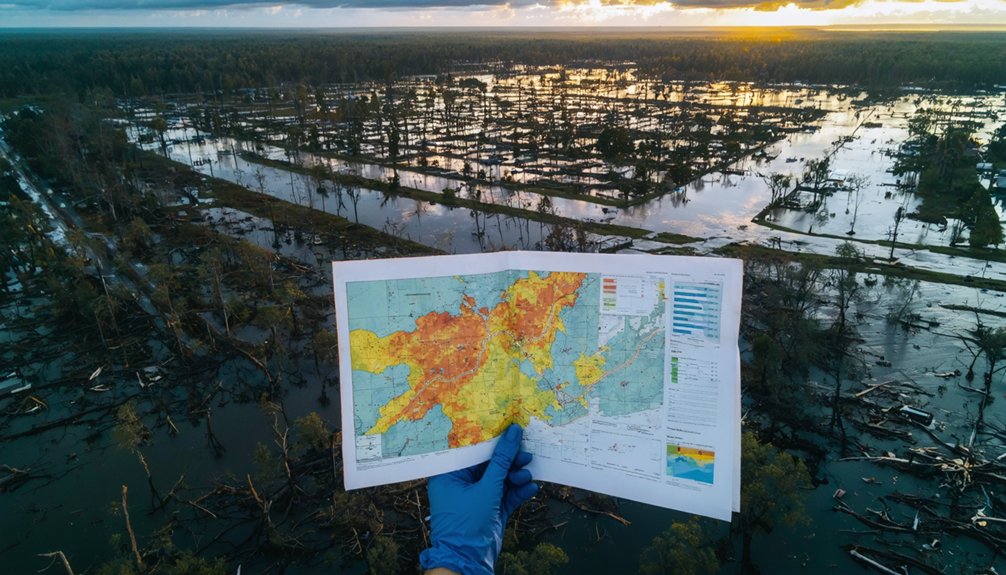
Researchers at the FAMU-FSU College of Engineering’s RIDER Center demonstrated this capability using Bay County, Florida imagery spanning five storms, including Category 5 Hurricane Michael. Their debris prediction models correlated vegetation loss estimates with wind speed, initial vegetation density, and roadway proximity, producing actionable hazard mapping outputs.
You can use these recovery assessment tools to identify damage hotspots before ground teams mobilize, accelerating storm aftermath response.
What Remote Sensing Reveals About Barrier Island Change
When you compare pre- and post-storm aerial imagery and airborne LiDAR data, you can quantify structural and morphological changes across barrier island systems at fine spatial scales.
LiDAR’s elevation resolution lets you detect subtle shifts in dune height, beach volume, and overwash extent that ground surveys can’t reliably capture.
These high-resolution datasets, collected shortly after landfall, give you the baseline you need to model coastal recovery trajectories and prioritize restoration efforts.
Capturing Pre- And Post-Storm Changes
Because barrier islands sit at the intersection of marine and terrestrial processes, they’re among the most geomorphically volatile landforms a hurricane can strike. Pre- and post-storm comparisons using airborne LiDAR and aerial imagery let you quantify storm impact across elevation profiles, shoreline positions, and structural footprints with measurable precision.
Morphological analysis of these datasets reveals dune erosion, overwash deposition, and inundation extents that ground surveys can’t efficiently capture at scale. Sensor calibration guarantees elevation data remains reliable across collection windows, strengthening hazard mapping accuracy.
Data visualization tools translate raw point clouds and spectral imagery into actionable formats supporting emergency response prioritization.
You can also track ecological resilience trajectories by monitoring vegetation recovery over successive imaging cycles, directly informing recovery strategies for vulnerable coastal communities dependent on barrier island protection.
LiDAR Detecting Morphological Shifts
Airborne LiDAR sharpens the pre- and post-storm comparison framework by translating raw elevation differentials into spatially explicit records of morphological change.
In lidar applications targeting barrier islands, you’re extracting granular dune erosion volumes, overwash deposit extents, and shoreline displacement data that ground surveys simply can’t replicate at scale.
Morphological analysis becomes actionable when elevation point clouds reveal localized structural losses invisible to optical sensors alone.
Key insights LiDAR delivers:
- Volumetric sand loss quantified across dune fields post-landfall
- Overwash fan geometry mapped with centimeter-level vertical precision
- Infrastructure elevation changes distinguishing storm-surge impacts from wave-driven scour
These datasets accelerate response prioritization, giving emergency coordinators independent, verifiable terrain intelligence rather than anecdotal field reports filtered through access-restricted disaster zones.
Improving Coastal Recovery Trajectories
Tracking recovery trajectories requires temporally sequenced datasets that capture how barrier island systems restabilize—or fail to—across weeks, months, and seasons following landfall.
You can’t rely on single-snapshot assessments when evaluating coastal resilience; dune rebuilding, sediment redistribution, and vegetation reestablishment unfold across dynamic, nonlinear timelines.
Aerial imagery and airborne LiDAR collected at defined post-storm intervals let you quantify volumetric change, elevation recovery, and structural stabilization against pre-storm baselines.
These comparisons expose which zones are recovering and which remain structurally vulnerable to subsequent storm events.
That intelligence directly informs recovery planning—helping you prioritize where protective infrastructure investments deliver the greatest long-term return.
High-resolution, temporally dense remote sensing data ultimately gives coastal managers the analytical leverage to make defensible, evidence-based decisions about where and how to intervene.
How Remote Sensing Detects Hurricane Damage in Forests and Mangroves
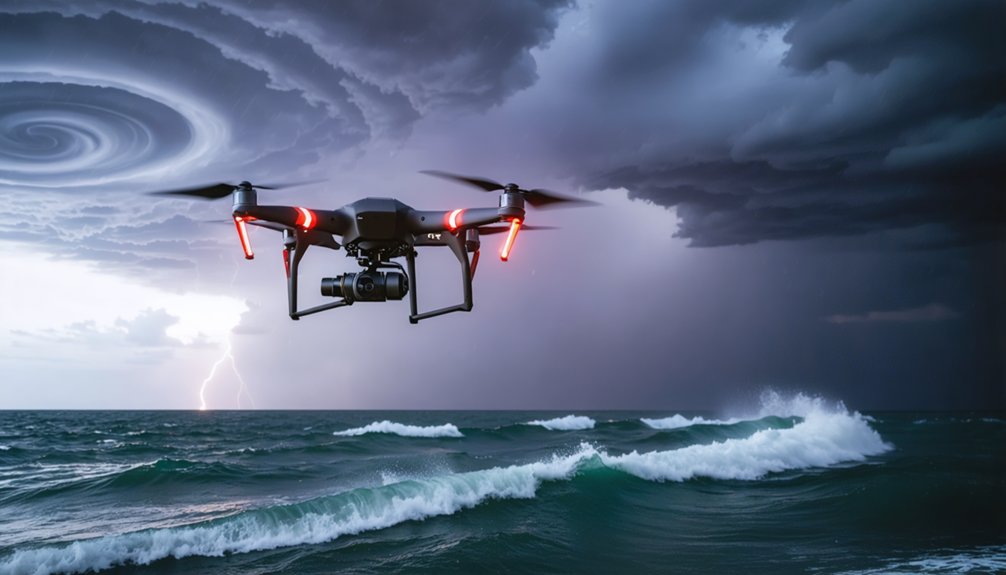
Although forests and mangroves lack the structural uniformity of built environments, remote sensing tools—satellite imagery, LiDAR, and UAVs—can detect hurricane damage across both ecosystem types by measuring changes in canopy height, density, and spectral reflectance.
Ecological monitoring across pre-storm, immediate post-storm, and recovery periods supports damage assessment, habitat analysis, and long-term recovery strategies.
- Satellite imagery tracks vegetation restoration and mangrove resilience by comparing spectral signatures before and after landfall.
- LiDAR captures 3D structural change, quantifying storm impact on canopy architecture critical for forest recovery modeling.
- UAVs deliver fine-scale data supporting ecosystem resilience evaluation and coastal management decisions.
Fine spatial and temporal resolution remains the primary gap limiting more precise recovery trajectory analysis.
Why Researchers Now Combine Satellites, LiDAR, and Drones

When you rely on a single sensor, you accept its blind spots—satellites offer broad coverage but limited resolution, LiDAR captures precise elevation data but lacks spectral detail, and drones provide fine-scale imagery but limited spatial extent.
By integrating all three, you close the data gaps that each sensor leaves open, producing a more complete picture of storm impacts across structural, morphological, and vegetative dimensions.
This multi-sensor approach is now driving research toward generalizable workflows that you can apply across different storm events, coastal geographies, and ecosystem types without rebuilding your methodology from scratch.
Sensor Integration Benefits
Because no single sensor captures the full picture of a hurricane’s impact, researchers now routinely integrate satellites, airborne LiDAR, and UAVs into unified workflows.
This sensor synergy through data fusion and integrated analysis sharpens measurement accuracy across spatial and temporal scales, enabling real-time monitoring and stronger predictive modeling.
Multi-platform strategies give you richer datasets than any standalone tool can deliver:
- Satellites provide broad coverage for tracking storm tracks, vegetation loss, and coastal inundation patterns
- Airborne LiDAR resolves fine-scale elevation changes, structural damage, and morphological shifts on barrier islands
- UAVs capture high-resolution visual detail in localized, high-priority zones immediately after landfall
Technology collaboration across these platforms eliminates critical data gaps, accelerating emergency response decisions and producing more defensible post-storm assessments.
Closing Data Gaps
Each sensor platform leaves measurable blind spots that compromise your analysis if left unaddressed. Satellites deliver broad coverage but lack spatial precision at fine scales. LiDAR captures elevation detail yet misses temporal resolution during rapid storm evolution. Drones retrieve high-resolution ground truth but cover limited areas.
Closing these gaps demands research collaboration across institutions, ensuring data accessibility without bureaucratic bottlenecks that restrict independent analysis.
You’ll need rigorous sensor calibration protocols to align datasets across platforms, and data interoperability standards that let you merge satellite, airborne, and UAV outputs within unified analysis frameworks.
Method standardization removes workflow inconsistencies that inflate uncertainty. Without it, cross-study comparisons collapse.
Establishing open, calibrated, interoperable systems lets you extract actionable storm-impact intelligence faster, cheaper, and with greater defensible accuracy across every hurricane-prone region you’re monitoring.
What Remote Sensing Still Can’t Tell Us About Hurricanes
Despite its transformative capabilities, remote sensing still can’t answer every critical question about hurricanes. Data limitations persist, particularly around localized impacts that coarse-resolution sensors miss entirely.
Temporal challenges compound this problem—satellites don’t always pass over at critical moments, leaving gaps in damage variability assessments and recovery timelines.
You’re still missing ground-truth precision on:
- Vegetation recovery rates at fine scales, where structural resilience of ecosystems resists reliable classification
- Coastal dynamics beneath storm surge, where submerged morphological shifts evade optical and LiDAR detection
- Interior structural damage, where building-level assessments require resolutions most current satellite constellations can’t consistently deliver
These gaps aren’t trivial. Without resolving them, your emergency response models, conservation strategies, and infrastructure planning remain built on incomplete foundations.
Frequently Asked Questions
How Accurate Are Satellite Intensity Estimates Compared to Hurricane Hunter Aircraft?
You’ll find aircraft measurements deliver superior satellite accuracy in hurricane tracking. Data comparison shows reconnaissance planes remain the most precise source, while satellites estimate intensity indirectly through cloud-altitude and temperature analysis, making aircraft measurements the gold standard.
Can Remote Sensing Data Predict Hurricane Storm Surge Heights Before Landfall?
Remote sensing data doesn’t directly predict storm surge heights, but you can integrate satellite technology into predictive modeling workflows. Data accuracy improves when you combine sea-surface, wind, and bathymetric inputs for pre-landfall surge forecasting.
How Quickly After Landfall Can Usable Aerial Damage Assessment Imagery Be Collected?
You can collect usable aerial surveys for damage assessment within hours after landfall. Remote sensing enables rapid post-storm evaluation, and imagery collection supports precise landfall timing analysis, letting you prioritize emergency response through actionable, data-driven results.
Are Remote Sensing Debris Prediction Models Applicable Outside Florida Hurricane Zones?
Yes, you can apply debris modeling techniques beyond Florida—they’re built on transferable variables like wind speed, vegetation loss, and road density, giving regional applicability wherever satellite imagery supports similar pre- and post-storm data collection.
How Long Does Barrier Island Recovery Typically Take After a Major Hurricane Strike?
Recovery timelines vary, but you’ll typically see barrier island resilience tested over 5–25 years post-strike. Post-hurricane ecology data show morphological stabilization often takes decades, while remote sensing tracks incremental change across vegetation regrowth, dune reformation, and structural recovery cycles.
References
- https://www.fau.edu/newsdesk/articles/remote-sensing-hurricane-ian.php
- https://research.monash.edu/en/publications/current-status-of-remote-sensing-for-studying-the-impacts-of-hurr/
- https://stormwater.wef.org/2024/05/remote-sensing-could-shape-the-future-of-natural-disaster-assessment/
- https://issnationallab.org/upward/tropical-cyclone-in-sight-tracking-hurricanes-typhoons-from-space/
- https://rider.eng.famu.fsu.edu/article/remote-sensing-research-improves-hurricane-response
- https://www.nawm.org/pdf_lib/jcr_flood_klemas_1109.pdf
- https://www.facebook.com/UniversityOfMichigan/posts/remote-sensing-technology-originally-designed-for-hurricane-forecasting-by-resea/666292256043138/
- https://www.sciencedirect.com/science/article/abs/pii/S0034425720303102
- https://www.cira.colostate.edu/wp-content/uploads/sites/4/2025/07/Remote-Sensing-of-Tropical-Cyclones-1.pdf
- https://ui.adsabs.harvard.edu/abs/2024usgs.soft..100C/abstract