Analyzing satellite imagery gives you an atmospheric edge that radar simply can’t match. You’re seeing outflow boundaries, moisture convergence, and upper-level divergence before a single precipitation particle triggers a radar return. Visible channels expose cloud structures in daylight, infrared reveals temperature differentials at night, and microwave penetrates dense cloud cover to expose internal storm dynamics. Combining both datasets sharpens your chase decisions markedly. There’s considerably more to this data-driven approach worth uncovering.
Key Takeaways
- Satellite imagery detects storm organization before radar by revealing upper-level divergence, moisture convergence, and cumulus field patterns indicating atmospheric destabilization.
- Visible channels provide clear daytime cloud structures, while infrared measurements capture temperature differentials and rapid cloud-top cooling preceding explosive storm development.
- Integrating satellite imagery with radar data creates a complete atmospheric picture, sharpening chase tactics and reducing repositioning lag during critical storm phases.
- Day/Night Band technology detects minimal radiation, including moonlight reflection, enabling continuous storm tracking and center detection without visible light overnight.
- Faster satellite refresh rates, targeting 12-minute intervals, enable real-time storm response and enhanced decision-making agility in rapidly changing conditions.
What Satellite Imagery Shows That Storm Chase Radar Can’t
Satellite imagery and radar each capture fundamentally different slices of atmospheric reality, and understanding that distinction sharpens how you interpret both data sources during an active chase.
Radar measures precipitation particles within a storm’s structure, but it won’t reveal the broader atmospheric context surrounding it. Satellite storm visualizations expose outflow boundaries, cold fronts, and sea surface temperature gradients that radar simply can’t detect.
Radar sees inside a storm. Satellite sees everything surrounding it.
Infrared channels map wind patterns across multiple atmospheric levels simultaneously. When thick cloud layers obscure a tropical system’s core, microwave cloud penetration cuts through that obstruction, confirming eye location and structural integrity.
You’re effectively gaining a top-down atmospheric perspective that complements radar’s ground-based cross-sectional view. Combining both datasets eliminates critical blind spots, giving you sharper situational awareness and more defensible positioning decisions during rapidly evolving severe weather.
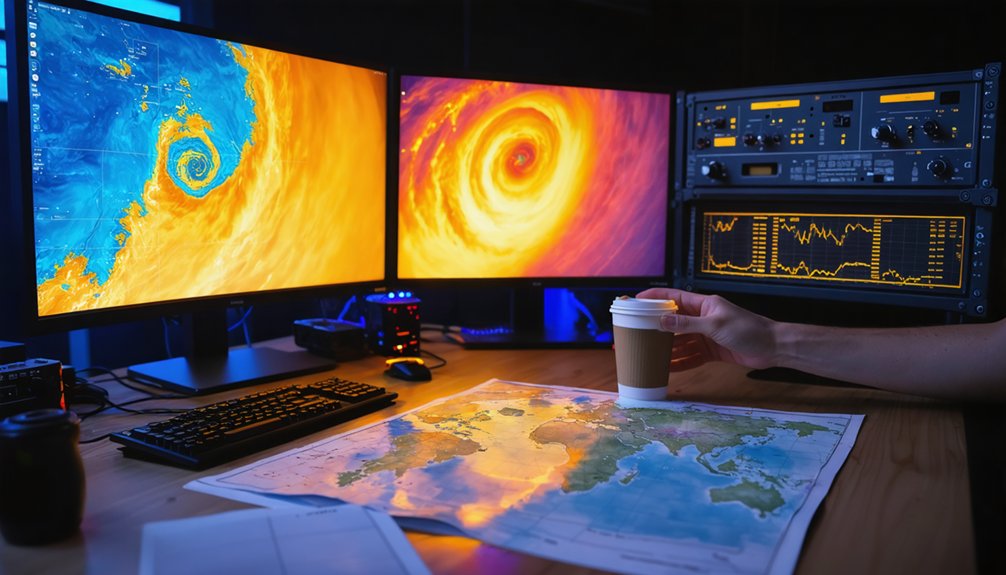
Visible, Infrared, and Microwave: Choosing the Right Satellite Channel
Each satellite channel captures a distinct slice of atmospheric data, so matching the right one to current conditions directly impacts your situational awareness.
Visible imagery delivers sharp cloud structures during daylight but fails completely at night. Infrared radiation measurements compensate, revealing atmospheric patterns and temperature differentials around the clock.
When dense cloud cover obscures storm characteristics, microwave channels penetrate that barrier, exposing internal structure that other sensors can’t reach.
You’ll hit measurement limitations with each channel individually, which is why data integration becomes your analytical advantage.
Combining all three eliminates blind spots across varying conditions and tracking challenges. Technology advancements, including proposed 12-minute satellite update intervals, will sharpen these capabilities considerably.
Until then, deliberately selecting and cross-referencing each channel gives you the most accurate, real-time picture of evolving storm behavior.
How Satellite Cloud Patterns Reveal Storm Behavior Before Radar Does
When you monitor satellite loops before a chase, you’ll notice cloud pattern signals that expose storm organization well before radar detects precipitation cores.
Satellite imagery captures the broad mesoscale environment — outflow boundaries, dry line signatures, and cumulus field organization — giving you a structural read on convective potential that radar simply can’t provide at that stage.
Early Cloud Pattern Signals
Cloud patterns captured in satellite imagery often reveal storm development signatures hours before radar detects precipitation, giving you a critical lead-time advantage in chase planning.
Visible and infrared channels expose upper-level divergence, boundary layer moisture convergence, and cirrus outflow expansion — all early warning indicators that precede convective initiation.
You’re watching cloud dynamics unfold in real time, identifying cumulus field organization and towering cumulus growth that signal atmospheric destabilization.
Anvil-top spreading patterns indicate strong updraft development before any precipitation core materializes on radar.
Tracking these structural signatures in GOES satellite loops lets you position yourself advantageously, intercepting storms at ideal distances rather than reacting to already-mature supercells.
Integrating these pre-radar signals into your chase strategy fundamentally shifts your decision-making from reactive to anticipatory.
Radar Versus Satellite Detection
Satellite imagery detects storm development signatures that radar simply can’t capture at the same lead times, and understanding this detection gap reshapes how you approach chase strategy.
Radar requires precipitation particles to generate returns, meaning it’s blind to developing convective structures before moisture concentrations reach detectable thresholds.
Satellite advantages emerge precisely here—cloud-top temperature gradients, cirrus outflow patterns, and boundary interactions become visible hours before radar paints anything meaningful.
You’re fundamentally watching storm intensity building through thermodynamic signatures while radar operators see nothing.
GOES infrared channels reveal upper-level divergence and rapid cloud-top cooling that precede explosive development.
When you combine satellite’s broad atmospheric perspective with radar’s precipitation detail, you’ve built a detection framework that neither instrument delivers independently, giving you genuine tactical freedom to position ahead of developing threats.
Predicting Storm Development Visually
Reading cloud patterns in real-time satellite loops gives you predictive capability that extends well beyond radar’s precipitation-dependent detection window.
Cloud property analysis reveals storm dynamics minutes to hours before precipitation develops, letting you position independently rather than reactively.
Watch for these visual cues in satellite loops:
- Rapid cloud-top cooling indicating explosive convective development
- Outflow boundary signatures marking invisible collision zones where new storms ignite
- Sea surface temperature gradients forecasting intensity shifts along your projected chase corridor
GOES continuous dual-wavelength measurements deliver the evolving atmospheric picture you need for autonomous route decisions.
When you’re reading convective initiation signals before radar even detects moisture, you’re operating ahead of the warning curve rather than chasing confirmation you’ve already missed.
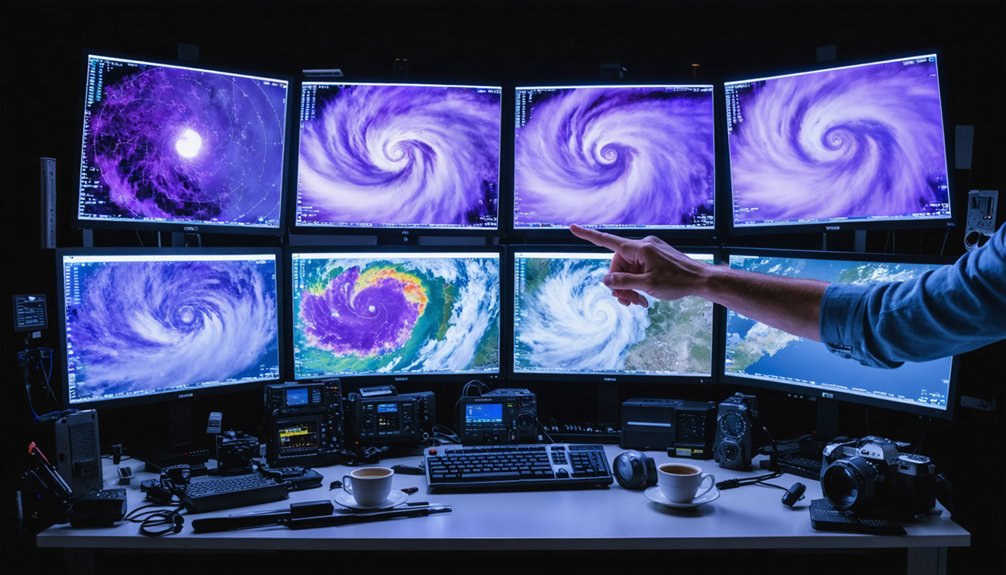
How GOES Satellites Track Storm Structure in Real Time
When you monitor active storm systems, GOES East and West satellites give you continuous evolution data through dual-wavelength measurement systems that simultaneously capture both infrared radiation and visible light.
You’re watching two distinct data streams merge into a single analytical picture—infrared quantifies cloud-top temperatures and wind patterns at multiple atmospheric levels, while visible channels document real-time structural changes in storm organization.
This dual-wavelength architecture means you’re never relying on a single sensor’s limitations, and you get continuous storm evolution monitoring that reveals intensification trends, boundary shifts, and structural anomalies as they develop.
Dual-Wavelength Measurement Systems
GOES East and West satellites continuously monitor storm systems using two primary measurement wavelengths—visible light and infrared radiation—giving meteorologists and storm chasers a dual-layer view of atmospheric conditions in near real time.
Dual wavelength advantages include independent verification of storm features across different atmospheric conditions. Measurement system efficacy improves considerably when both channels operate together:
- Visible light captures daytime storm structure with high spatial clarity.
- Infrared radiation tracks cloud-top temperatures and wind patterns across multiple atmospheric levels.
- Combined analysis reveals storm intensity trends that neither wavelength identifies alone.
You’re not dependent on a single data stream. When visible imagery degrades at night or under dense overcast, infrared fills the observational gap—keeping your situational awareness continuous, accurate, and operationally reliable throughout evolving storm scenarios.
Continuous Storm Evolution Monitoring
Tracking a storm’s structural evolution in real time demands continuous, uninterrupted observation—and that’s precisely what GOES East and West satellites deliver.
These platforms monitor the complete storm lifecycle by measuring dual-wavelength infrared and visible radiation simultaneously, giving you an unbroken data stream that captures every structural shift as it happens.
You’re not working from static snapshots—you’re analyzing dynamic loops that reveal boundary movement, intensification signatures, and organizational changes minute by minute.
This continuous coverage means you can identify critical decision windows before conditions on the ground force your hand.
Understanding these satellite capabilities lets you anticipate storm behavior rather than react to it, translating raw atmospheric data into actionable positioning intelligence.
That analytical advantage separates informed chase decisions from dangerous guesswork.
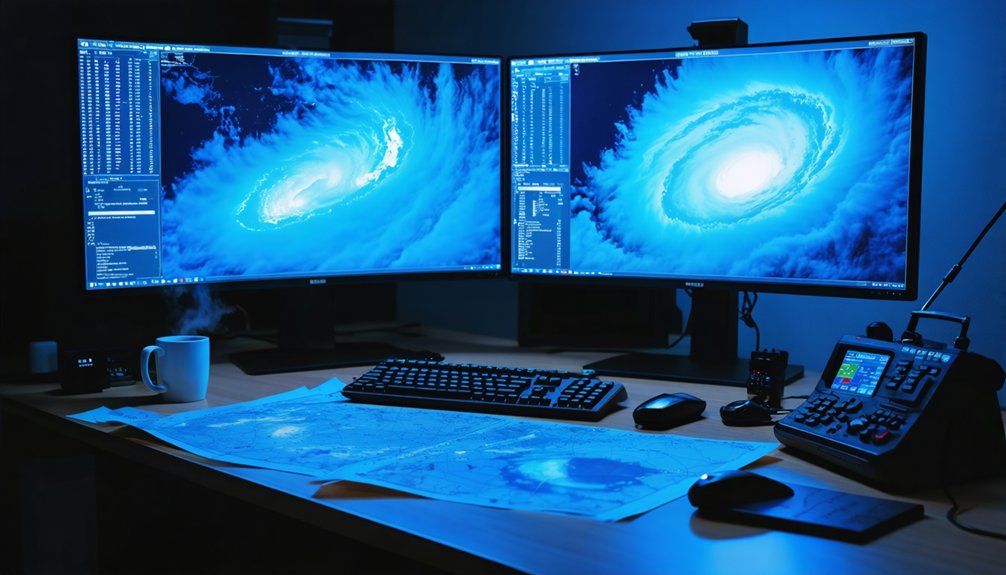
Nighttime Satellite Tracking With Day/Night Band Technology
Nighttime presents one of the most persistent challenges in satellite-based storm tracking, but the Day/Night Band (DNB) channel directly addresses this operational gap. When visible imagery fails after sunset, you’re not left blind. DNB detects minimal radiation, including moonlight reflection, giving you actionable storm data through the darkness.
Here’s what DNB delivers for your nighttime operations:
- Storm center detection without relying on visible light wavelengths
- Structural feature identification using reflected moonlight radiation
- Continuous tracking capability that eliminates the sunset gap in your observation window
Weaker tropical systems lacking defined eye structure create the steepest nighttime challenges. DNB compensates directly, letting you maintain situational awareness when traditional visible channels go dark and your positioning decisions can’t wait until morning.
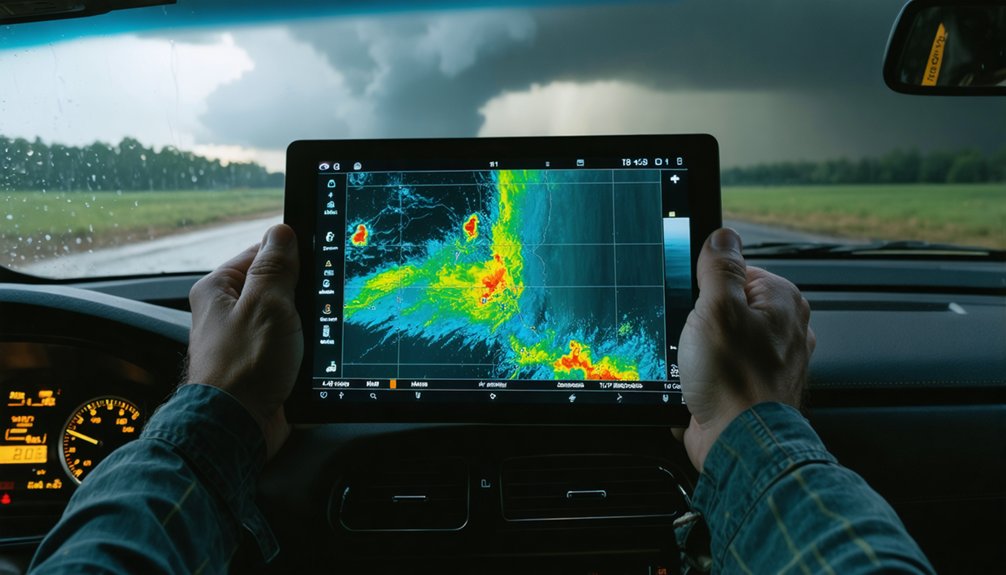
How to Make Live Chase Decisions Using Satellite and Radar Together
When satellite imagery and radar data operate in isolation, you’re working with an incomplete atmospheric picture—but integrating both systems in real time gives you the tactical edge that separates effective chase positioning from dangerous guesswork.
Satellite loops reveal outflow boundaries, developing convection, and storm intensity trends before radar fully resolves them. Radar then delivers precise reflectivity, velocity, and rotation data that satellite can’t provide at ground level.
Your chase tactics sharpen considerably when you’re cross-referencing both simultaneously—satellite identifies where development is accelerating, while radar confirms structural organization and mesocyclone strength.
Watch for satellite-indicated cloud-top cooling paired with strengthening radar signatures; that combination signals rapid intensification.
This dual-system approach eliminates blind spots, keeps your positioning ahead of storm movement, and gives your decisions a measurable data foundation.
What Faster Satellite Updates Mean for Real-Time Chase Decisions
The dual-system approach you’ve built between satellite and radar only performs as well as the data refresh rates feeding it—and right now, satellite update frequency remains the weaker link.
Current once-per-day microwave passes leave critical gaps in storm evolution tracking. Next-generation satellites targeting 12-minute update intervals will fundamentally change your decision-making window.
Faster satellite accuracy improvements deliver three tactical advantages:
- Tighter positioning decisions when outflow boundaries shift unexpectedly
- Earlier intensification signals before radar confirms structural changes
- Reduced repositioning lag as storm evolution accelerates during critical phases
When refresh rates compress from hours to minutes, you’re no longer reconstructing what a storm did—you’re responding to what it’s doing.
That operational difference determines whether your chase succeeds or fails.
Frequently Asked Questions
How Do Sea Surface Temperatures Influence Hurricane Intensity Predictions From Satellites?
You’ll use sea surface temperature measurements to detect temperature anomalies and ocean dynamics that directly fuel hurricane intensity. Satellites track these thermal signatures, helping you predict rapid intensification before storms strike landfall.
Which Specific Satellites Captured Imagery of Category-5 Storm Eye Structures?
You’ve got the most jaw-dropping hurricane characteristics captured by NOAA-20 and Suomi-NPP satellites—these satellite technology powerhouses revealed near-perfect circular eye structures, giving you unmatched analytical data on Category-5 storm formations with extraordinary precision.
How Do Storm Spotters Use Satellite Data During Active Ground-Based Chasing Operations?
You’ll use satellite data for real-time analysis of storm boundaries and structural evolution, combining it with radar for superior data interpretation. It’s your tactical edge, revealing development zones and guiding independent chase positioning decisions effectively.
What Update Frequency Do Next-Generation Satellites Target for Storm Observation?
Like clockwork ticking faster across storm-swept skies, next-generation satellites target 12-minute update intervals, dramatically expanding your satellite capabilities to capture rapid storm evolution with precision that today’s once-per-day measurements simply can’t match.
How Does Microwave Imagery Detect Storm Structure Hidden Beneath Dense Cloud Cover?
You’ll detect hidden storm structure because microwave technology penetrates dense cloud cover by measuring radiation wavelengths that pass through clouds, enabling cloud penetration to reveal eye location and internal organization that visible imagery can’t capture.
References
- https://www.stormtours.com/information/nowcasting-explained/
- https://www.nesdis.noaa.gov/news/guide-understanding-satellite-images-of-hurricanes
- https://www.wiu.edu/SevereWeather/images/presentations/How_to_Effectively_Storm_Chase.pdf
- https://www.youtube.com/watch?v=A7E9S_3qEoA
- https://www.youtube.com/shorts/Q-_cpK3Q6Ko
- https://www.youtube.com/watch?v=a1YMpwnMlFc
- https://www.youtube.com/playlist?list=PLVEuvNuSbsGgOY0ipyHTGM2FjG8Xd6KxV
- https://www.weather.gov/oun/stormspotting