Predicting severe weather accurately means you’re analyzing instability, moisture, lift, and wind shear before storms ever develop. You’ll use Skew-T soundings, radar, and ensemble models to identify where atmospheric conditions converge into genuine threats. Storm chasers then fill critical gaps by delivering real-time ground truth that radar signatures alone can’t confirm. Combining these data streams sharpens warning accuracy and reduces false certainty—and every layer of this process reveals exactly how forecasters protect lives before threats materialize.
Key Takeaways
- Accurate severe weather prediction depends on analyzing instability, moisture, lift mechanisms, and wind shear as four critical atmospheric ingredients.
- Weather balloons and upper-air soundings reveal capping inversions, moisture profiles, and CAPE values, enabling independent verification of model outputs.
- Model diversity presents a range of possible outcomes, prioritizing genuine predictive accuracy over false certainty in severe weather guidance.
- Storm chasers provide real-time ground-level observations on wall clouds and atmospheric anomalies that radar alone cannot reliably capture.
- Integrating radar, soundings, forecast models, and chaser reports sharpens warning accuracy, ensuring threats are communicated before they materialize.
Why Atmospheric Analysis Underlies All Severe Weather Prediction
Before a forecaster can anticipate where severe weather will develop, they must first understand what the atmosphere is doing right now. Atmospheric analysis gives you the foundation. You’re pulling data from satellites, radar, weather balloons, surface stations, and aircraft to build an accurate picture of current conditions.
Skew-T log P soundings reveal critical predictive variables — instability, moisture depth, capping strength, and wind shear profiles. From those, you can estimate CAPE, CIN, and updraft potential before a single storm fires.
Skew-T soundings expose what the atmosphere is hiding — instability, moisture, and shear — before storms ever form.
Without precise atmospheric dynamics guiding your interpretation, downstream model initialization degrades, and your severe weather guidance loses reliability.
Every forecast decision you make — timing, storm mode, hazard type — traces back to how accurately you’ve analyzed the atmosphere’s present state.
The Four Ingredients That Trigger Severe Storm Development: Instability, Moisture, Lift, and Shear
Once you’ve locked in your atmospheric analysis, the next step is evaluating whether four critical ingredients are simultaneously present: instability, moisture, lift, and wind shear.
Instability types—CAPE, convective inhibition, and lapse rates—define thermodynamic relationships within atmospheric profiles. Moisture sources, including Gulf inflow and boundary layer dewpoints, fuel convective processes and determine storm environments capable of sustaining severe weather.
Lift mechanisms like frontal boundaries, drylines, and orographic forcing trigger initiation when capping weakens sufficiently. Shear profiles—both directional and speed-based—control storm dynamics, separating pulse convection from organized supercells or linear systems.
You’re fundamentally diagnosing whether the atmosphere can sustain deep, moist convection. When all four ingredients converge simultaneously, severe weather becomes increasingly likely, and your forecast confidence rises accordingly.
How Weather Balloons and Soundings Reveal Hidden Storm Potential
While surface observations tell part of the story, weather balloons and upper-air soundings reveal what’s happening through the full depth of the atmosphere—information you can’t extract from surface data alone.
Surface observations only scratch the surface—weather balloons expose what’s actually happening through the atmosphere’s full depth.
Skew-T soundings cut through atmospheric layers, exposing moisture analysis gaps, capping inversions, and storm stability signals that determine whether storm initiation actually occurs.
Key parameters you’ll pull directly from soundings:
- CAPE estimates quantifying available energy and updraft strength potential
- Moisture profiles identifying favorable cloud formation depth and saturation layers
- Lapse rates revealing instability gradients critical for hail potential
- CIN values exposing cap strength that controls convective timing
Mastering Skew-T interpretation gives you independent verification of model output—keeping your severe weather forecast grounded in real atmospheric data rather than blind model trust.
What GFS, ECMWF, and Convection-Allowing Models Tell Us About Incoming Severe Weather
When you’re tracking a potential severe weather outbreak several days out, global models like the GFS and ECMWF are your first tools for identifying broad signals—upper-level troughs, surface boundaries, and thermodynamic setups that favor organized convection.
As the event draws closer, convection-allowing models give you finer detail on storm mode, initiation timing, and mesoscale features that global models simply can’t resolve.
Comparing output across both model types lets you gauge forecast confidence and identify where solutions agree or diverge before committing to a specific severe weather scenario.
Global Model Severe Signals
Before a single storm develops, global models like the GFS and ECMWF are already flagging the large-scale ingredients that drive severe weather outbreaks. These global model applications give you a multi-day heads-up by resolving jet stream positioning, moisture transport, and synoptic-scale lift.
Recognizing severe signal implications early lets you stay ahead of rapidly evolving setups:
- Jet stream dynamics — Sharp troughs amplify wind shear and force surface cyclogenesis
- Moisture advection — Deepening dewpoints signal fuel for explosive convective development
- 500 mb vorticity — Positive vorticity advection identifies favored lift regions days out
- Model agreement — When GFS and ECMWF align, confidence in the severe threat increases considerably
You’re not reacting to storms — you’re anticipating them using the clearest large-scale signals available.
Convection-Allowing Model Detail
Once global models flag a potential severe weather setup, convection-allowing models (CAMs) sharpen the picture considerably. Running at grid spacings of 3 kilometers or less, CAMs resolve individual storm dynamics that coarser models simply can’t capture.
You’re seeing explicit convection patterns rather than parameterized approximations, which means better depictions of storm mode, timing, and placement.
Where the GFS might suggest a broad severe threat, a CAM shows you whether discrete supercells, squall lines, or messy convective clusters are most likely. That distinction matters enormously for warning strategy and public communication.
CAMs also help you evaluate storm initiation timing, which directly influences when peak threats materialize. Comparing multiple CAM runs builds your confidence and reveals where forecast uncertainty remains highest within the severe weather window.
Comparing Model Forecast Confidence
Each model system brings different strengths to the table, and understanding those strengths lets you extract more actionable intelligence from your forecast workflow.
GFS offers broad storm likelihood signals days out, while ECMWF’s superior data assimilation consistently improves forecast accuracy at medium range. Convection-allowing models sharpen atmospheric dynamics closer to event time.
Use outcome comparison across systems to drive your uncertainty assessment:
- GFS vs. ECMWF agreement raises predictive confidence in storm timing and placement
- Diverging solutions signal sensitive atmospheric dynamics requiring cautious risk communication
- CAM ensemble clustering refines model reliability for convective mode and initiation
- Consistent instability and shear parameters across models strengthen storm likelihood forecasts
When models converge, trust sharpens. When they diverge, widen your uncertainty envelope and reassess.
Why Ensemble Forecasting Takes the Guesswork Out of Storm Prediction
When a single model run tells you a squall line will push through at 7 PM, that’s one solution from one set of initial conditions—and the atmosphere rarely cooperates that neatly.
Ensemble simulations solve this by running dozens of model variations simultaneously, each initialized with slightly different conditions reflecting real atmospheric variability. You’re no longer locked into one deterministic outcome.
When ensemble members cluster tightly, forecast reliability improves and you can commit to a more confident storm evolution scenario.
Tight ensemble clustering means the atmosphere is speaking clearly—and your forecast confidence can rise with it.
When they diverge, uncertainty quantification signals that the atmosphere is sensitive—and risk communication needs to reflect that honestly.
Model diversity across ensemble members reveals the range of possible outcomes rather than masking them. That transparency gives you actionable information and genuine predictive accuracy instead of false certainty.
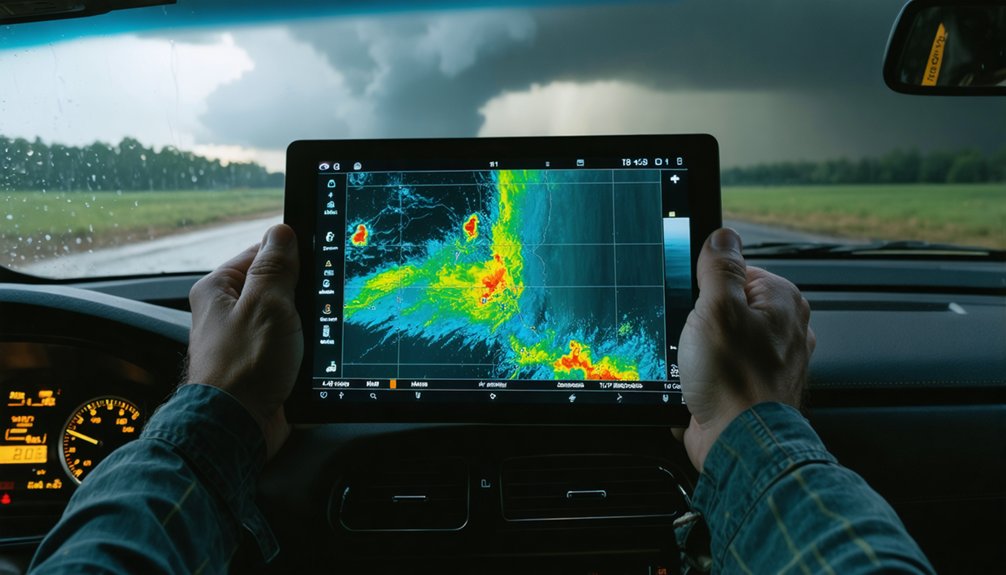
How Radar and Sensor Networks Detect Severe Weather in Real Time

When you’re tracking an active storm, weather radar becomes your most direct window into what’s happening inside a convective system, revealing rotation, hail cores, and precipitation intensity through reflected energy pulses.
You can extend that situational awareness by integrating sensor networks that continuously monitor surface temperature, wind, pressure, and moisture, giving you a real-time picture of how environmental conditions are evolving around the storm.
Together, radar and sensor data feed into alert systems that allow you to issue or refine severe weather warnings as storm structure changes minute by minute.
Radar Detecting Storm Structures
Radar systems are one of your most critical tools for detecting severe weather in real time, sending out pulses of microwave energy and measuring what bounces back from precipitation targets. Echo patterns reveal storm structure, while velocity data exposes rotation, divergence, and wind shear embedded within storm dynamics.
Radar integration with multi-sensor networks sharpens precipitation detection and extends your storm tracking capability considerably.
- Reflectivity gradients identify hail cores, bow echoes, and supercell organization
- Dual-polarization radar improves hydrometeor classification and analysis techniques
- Velocity data pinpoints mesocyclone development before tornadoes reach the surface
- Radar limitations like beam blockage and range degradation require supplemental data sources
Understanding these tools lets you cut through uncertainty and make sharper, faster decisions when severe storms develop.
Sensor Networks Monitoring Conditions
Beyond radar, a dense web of surface sensors, mesonets, and automated stations feeds you continuous, ground-level observations that radar simply can’t resolve on its own.
These networks track temperature, pressure, wind, and humidity with precision that sharpens your situational awareness during rapidly evolving severe weather events.
Sensor deployment across varied terrain closes critical observational gaps. Strict sensor calibration protocols maintain observation accuracy, while data integration pipelines merge inputs from thousands of stations into unified, real-time processing streams.
Network reliability guarantees that data flows without interruption, even during high-impact events when you need it most.
Technology advancements now allow sophisticated data visualization tools to render complex sensor datasets into actionable forecast products.
You can identify mesoscale boundaries, surface boundaries, and moisture gradients faster, tightening your warning lead times considerably.
Real-Time Severe Weather Alerts
All that sensor and radar data flowing into your processing streams serves one urgent purpose: triggering accurate, timely severe weather alerts before hazards reach populated areas.
Real time alerts depend on fusing radar signatures, surface observations, and model guidance into actionable decisions within seconds. Emergency communication systems then push those decisions outward, giving communities the lead time needed to act independently.
- Rotation signatures and hook echoes on Doppler radar trigger tornado warnings before touchdown confirmation
- MRMS hail algorithms flag severe thresholds, accelerating warning issuance for fast-moving supercells
- Automated surface observations feed alert thresholds, reducing warning latency in data-sparse regions
- Wireless Emergency Alerts and NOAA Weather Radio deliver real time alerts directly to individuals without intermediary dependency
Your situational awareness, paired with reliable emergency communication, keeps decision-making in your hands.
How Storm Chasers Provide Ground-Level Data That Radar Alone Cannot Capture
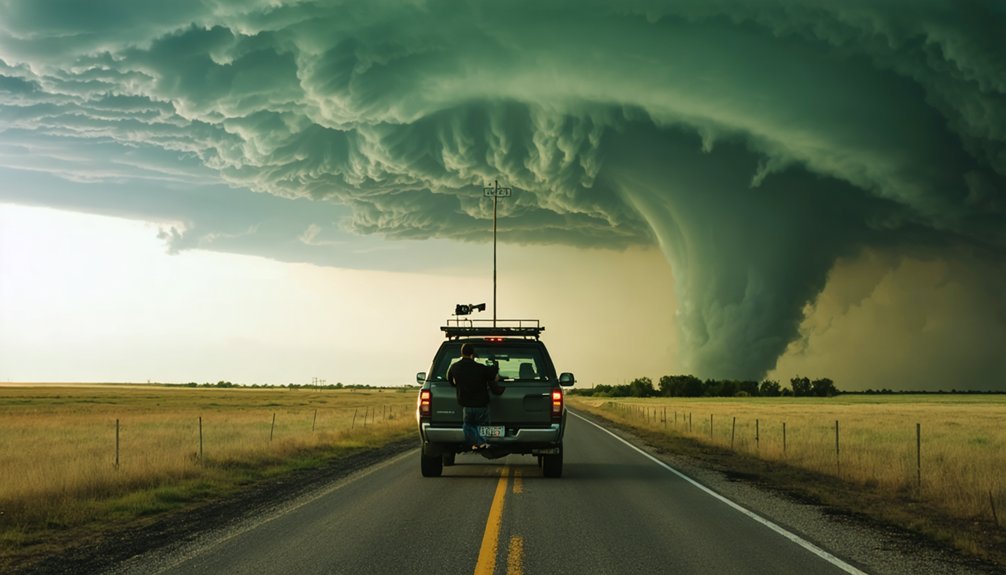
While radar excels at detecting precipitation intensity and broad rotation signatures, it can’t resolve fine-scale storm features that trained ground observers capture directly.
When you integrate chaser collaboration into your forecast workflow, observational accuracy improves considerably. Chasers deliver real-time insights on wall cloud development, inflow strength, and atmospheric anomalies that remote sensing misses entirely.
Visual confirmation of rotation tightening, debris signatures, or hail size refines your risk assessment beyond what radar interpolation provides. Effective chase strategies position observers where storm dynamics are most critical, maximizing data integration across multiple sensing platforms.
Clear communication protocols guarantee chaser reports reach warning meteorologists rapidly, closing observational gaps during fast-evolving severe weather. You gain a ground-truth layer that strengthens forecast confidence and ultimately supports more precise, timely, and life-saving warning decisions.
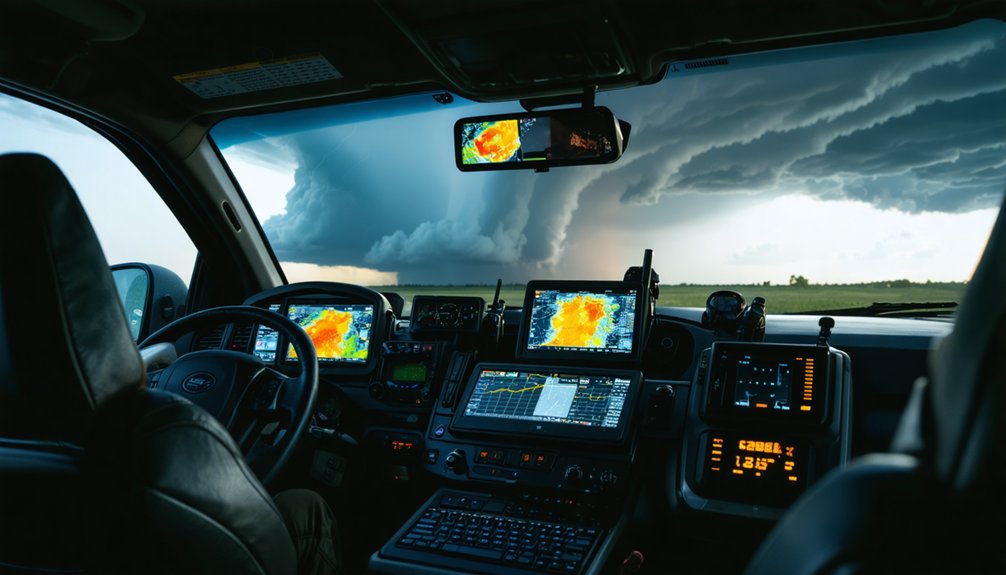
Why Chaser Reports and Radar Analysis Are Most Powerful When Combined
When you pair chaser reports with radar analysis, you get a feedback loop that neither source can produce alone—ground observations confirm or challenge what the radar signature suggests, sharpening your interpretation of rotation strength, hail size, and storm structure.
You rely on real-time ground truth to close the gap between what the radar shows and what’s actually occurring at the surface, especially when beam overshooting or range degradation limits low-level coverage.
That combined data stream directly supports more confident, timely warning decisions by anchoring probabilistic radar-based assessments to verified storm-scale behavior.
Chaser Reports Enhance Radar
Radar tells you what’s happening inside a storm, but chaser reports tell you what’s happening beneath and around it. Combining both data streams sharpens your observational accuracy and eliminates blind spots no algorithm can fill alone.
- Chasers confirm wall clouds, rotation, and ground contact that radar can only suggest.
- Chaser technology like mobile mesonets measures surface pressure drops and wind shifts in real time.
- Visual confirmation of hail size validates radar-estimated values and refines hail swath analysis.
- Ground-level storm structure reports clarify whether a radar-indicated circulation is producing a tornado.
When you merge what radar detects aloft with what trained eyes observe at ground level, your forecast confidence climbs. Neither tool is complete without the other.
Real-Time Ground Truth Matters
Ground truth closes the gap between what models estimate and what the atmosphere actually does.
When you combine chaser reports with radar analysis, you’re pulling from two independent data streams that validate each other in real time.
Radar quantifies storm dynamics through velocity, reflectivity, and rotation signatures, but it can’t confirm what’s actually happening at the surface. Your eyes can.
A confirmed wall cloud, visible rotation, or golf ball-sized hail gives forecasters the verification needed to issue confident, life-saving warnings. Without ground truth, you’re forecasting blind in the final mile.
When chasers relay structured, accurate reports and radar operators interpret those reports alongside scan data, the combined picture sharpens dramatically.
That integration doesn’t just improve forecasts—it compresses the time between storm development and public warning.
Combined Data Improves Warnings
That real-time verification becomes most actionable when chaser reports and radar analysis aren’t running parallel—they’re running together. Data synergy between field observations and predictive technology sharpens warning accuracy in ways neither source achieves alone.
Chaser collaboration feeds atmospheric feedback directly into decision pipelines, while model integration refines storm data against observed ground truth.
When you combine these inputs, you’re not guessing—you’re confirming:
- Rotation confirmed visually closes the gap between radar signatures and actual tornado development
- Hail size reports calibrate radar-estimated storm intensity against real surface impact
- Wall cloud observations validate updraft strength assumptions embedded in model integration outputs
- Chaser collaboration timestamps help synchronize atmospheric feedback loops for faster warning issuance
Combined storm data doesn’t just improve warnings—it accelerates them.
How Forecasters Weigh Every Data Source Before Issuing a Warning
Before issuing a severe weather warning, forecasters integrate data from every available source—satellites, soundings, radar, surface observations, and model guidance—to build a coherent picture of storm potential and current behavior.
Through data synthesis and observation verification, you confirm that model calibration aligns with real-time radar signatures and chaser coordination reports from the field. Risk assessment sharpens when technology integration connects multi-sensor platforms with decision support tools, letting you cross-examine conflicting signals before committing to alert dissemination.
Communication strategies must remain clear and direct, ensuring warnings reach vulnerable populations without delay. Event analysis after each significant storm refines your methodology, exposing gaps in your process.
Every data layer earns its weight through demonstrated accuracy—nothing gets issued on assumption alone.
How Forecasters Combine Every Tool to Save Lives During Active Severe Weather
When severe weather becomes active, you’re no longer building a forecast—you’re executing one in real time, with lives depending on how quickly and accurately you synthesize every incoming data stream.
Data integration across radar, ensemble guidance, and predictive modeling drives every warning decision during rapid storm evolution.
- Track atmospheric dynamics shifts using Doppler velocity and MRMS hail swaths simultaneously
- Validate observational accuracy by cross-referencing chaser reports against radar-indicated rotation signatures
- Adjust risk communication instantly when storm mode changes from discrete supercells to linear segments
- Prioritize chaser safety by monitoring storm-relative positioning against observed severe weather trajectory
You control the outcome by refusing to rely on any single source.
Every tool works together—radar, soundings, models, and ground truth—so warnings reach people before the threat does.
Frequently Asked Questions
How Do Soil Moisture Levels Influence Severe Storm Cap and Jet Structure?
Soil moisture directly shapes your storm cap and jet structure. Higher moisture levels boost evaporation rates, strengthening atmospheric stability and temperature gradients. You’ll notice altered precipitation patterns and a more intense low-level jet structure influencing severe storm development.
Can Terrain and Topography Physically Trigger or Suppress Severe Storm Initiation?
Yes, terrain impacts and topography effects can trigger or suppress initiation. You’ll find elevation influences force lift over ridges, while landscape variations channel wind shear, either sparking convection or disrupting the moisture and instability needed for storm development.
What Role Do Aircraft Observations Play in Initializing Severe Weather Forecast Models?
You’re directly improving model initialization when aircraft data feeds real-time temperature, wind, and humidity readings into numerical systems. That observational accuracy sharpens atmospheric state estimates, tightening forecast precision and boosting your confidence in severe weather model guidance.
How Does Differential Surface Heating Contribute to Creating a Severe Storm Environment?
When you’re tracking storm dynamics, differential heating creates temperature contrasts that drive surface convergence, enhance instability, and strengthen low-level wind shear—giving you the volatile atmospheric foundation severe storms need to ignite and intensify.
How Do Ocean Conditions Influence the Early Atmospheric Analysis for Severe Weather Forecasting?
You’ll find that ocean currents drive temperature anomalies, boosting evaporation rates and fueling moisture-laden air masses. These altered wind patterns directly shape early atmospheric analysis, giving you sharper instability signals and more reliable severe weather forecast initialization.
References
- https://www.weather.gov/media/zhu/ZHU_Training_Page/convective_parameters/Stability_Indices_severe_wx.pdf
- https://www.cc-ema.org/post/severe-wx-forecasting-timelines
- https://www.nssl.noaa.gov/education/svrwx101/thunderstorms/forecasting/
- https://www.weathercompany.com/blog/what-is-severe-weather-a-guide-to-forecasting-violent-storms/
- https://apps.dtic.mil/sti/tr/pdf/ADA129247.pdf
- https://obamaadministration.archives.performance.gov/content/improve-forecasting-accuracy-and-lead-times-severe-weather.html
- https://www.ametsoc.org/ams/about-ams/ams-statements/statements-of-the-ams-in-force/weather-analysis-and-forecasting2/
- https://ral.ucar.edu/technologies/forecasting-systems
- https://research.noaa.gov/three-ways-noaa-research-works-to-improve-our-weather-forecasts/
- https://caps.ou.edu/projects.php