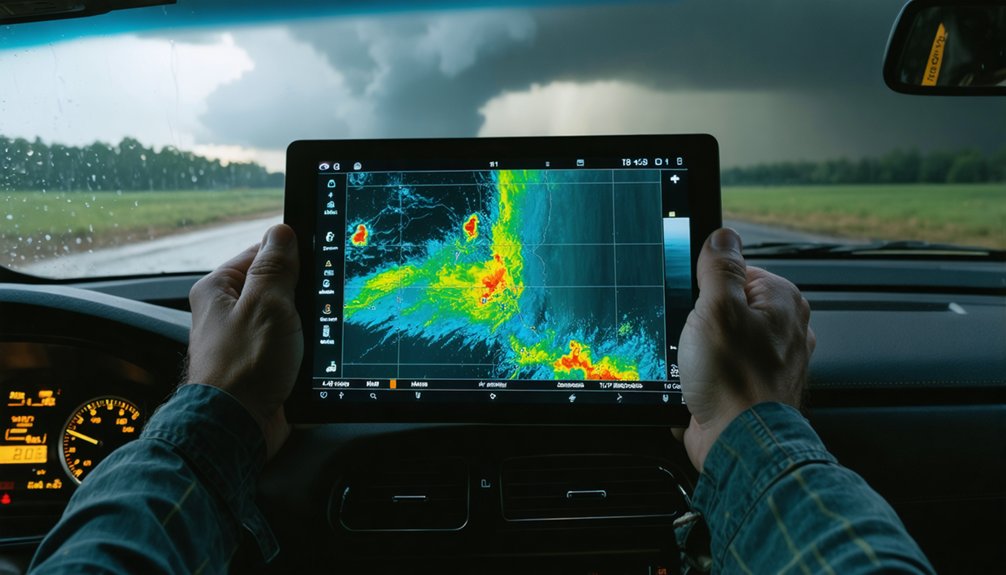
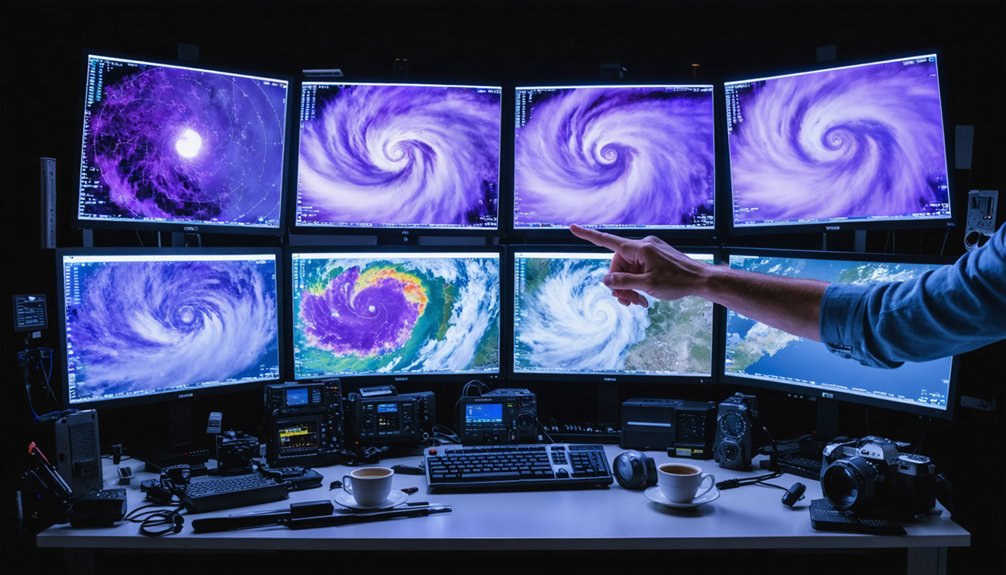
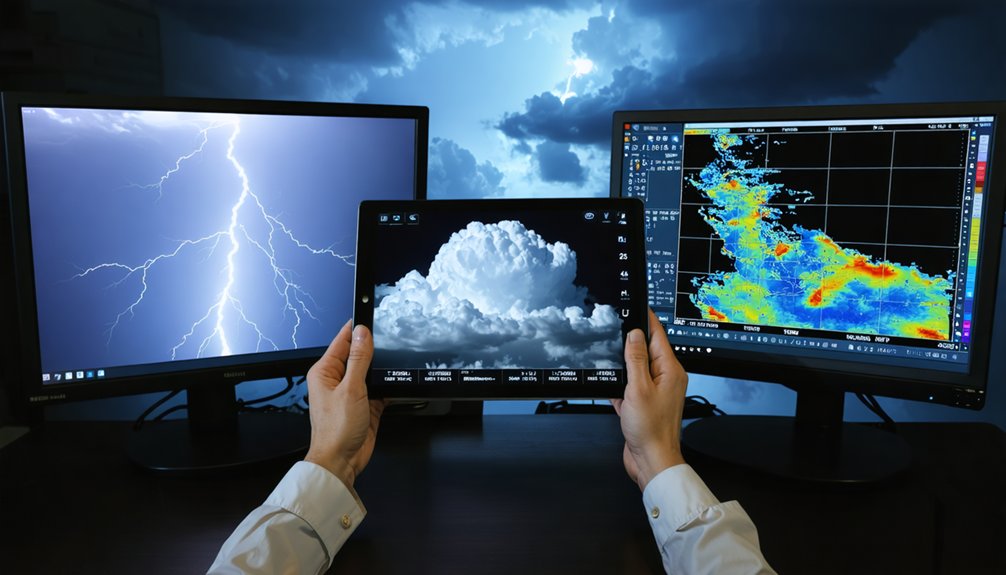
For storm chasing, you’ll rely on RadarScope and RadarOmega for high-resolution radar feeds, GOES-16 for rapid satellite updates, and ArcGIS or QGIS for geospatial terrain mapping. Global models like GFS via Tropical Tidbits and Windy sharpen your forecast accuracy, while heatmapping and clustering tools pinpoint high-risk corridors fast. Combining these platforms into one integrated workflow separates reactive chasers from those who anticipate what a storm does next.
Key Takeaways
- RadarScope and RadarOmega deliver high-resolution, real-time radar feeds with advanced storm structure analysis, essential for quick supercell and tornado identification.
- GOES-16 satellite imagery provides rapid 30-second scan updates, multi-spectral data, and infrared imaging for continuous live storm monitoring.
- ArcGIS and ArcScene offer 3D storm track visualization, terrain mapping, and geospatial overlays for precise trajectory analysis and situational awareness.
- Heatmap and clustering tools visually encode storm intensity through color gradients, helping storm chasers identify high-risk zones and severe weather corridors.
- Global weather models like GFS, Windy, and Tropical Tidbits aggregate forecast data, improving accuracy and supporting rapid severe weather decision-making.
Best Radar Apps Storm Chasers Actually Rely On
When it comes to radar applications that storm chasers actually trust in the field, two platforms dominate: RadarScope and RadarOmega. Both deliver high-resolution radar data essential for precise storm tracking, but they serve slightly different operational needs.
RadarScope excels in delivering clean, high-definition radar feeds across iOS and Android, giving you reliable real-time updates on storm intensity and movement. Its advanced meteorological features streamline data interpretation, letting you identify supercell structures quickly and confidently.
RadarScope delivers razor-sharp radar feeds and powerful meteorological tools, making supercell identification fast and reliable.
RadarOmega, which gained traction in the 2020s, offers flexible visualization tools and spatial analysis plugins that complement complex storm pattern analysis. You’ll find its customizable notification system particularly useful for anticipating tornado development.
Together, these apps give you the situational awareness needed to chase freely and safely.
GIS Platforms Storm Chasers Use for Real-Time Mapping
When you’re mapping storm systems in real time, ArcGIS stands out as a precision tool, offering robust geospatial data layers and live meteorological overlays that let you visualize complex storm patterns with high accuracy.
If you’re working within budget constraints or need greater flexibility, QGIS provides a powerful open-source alternative, with specialized spatial analysis plugins that extend its meteorological functionality considerably.
Together, these platforms equip you with the spatial intelligence needed to navigate storm-affected terrain and anticipate rapidly evolving weather events.
ArcGIS Real-Time Mapping
ArcGIS stands as one of the most powerful GIS platforms storm chasers use for real-time mapping, offering robust geospatial data integration with live meteorological overlays. You can leverage its high-definition satellite imagery to enhance situational awareness during active chase operations, giving you precise visual context when conditions shift rapidly.
ArcGIS excels in storm pattern analysis by combining topographic data, digital elevation models, and real-time atmospheric feeds into a unified interface. Its data synchronization capabilities guarantee your mapping environment stays current, pulling live radar and satellite inputs simultaneously without lag-induced blind spots.
You’re not locked into static views either. ArcGIS supports three-dimensional storm track visualization through ArcScene, letting you interpret complex atmospheric structures with greater spatial accuracy and make faster, better-informed decisions in dynamic field conditions.
QGIS Spatial Analysis Plugins
Where ArcGIS dominates through proprietary infrastructure, QGIS counters with an open-source architecture that you can extend through specialized spatial analysis plugins tailored to meteorological workflows. Plugin customization lets you build environments that match your exact storm-chasing requirements without licensing constraints.
Key QGIS capabilities for storm analysis include:
- Topological analysis tools that map spatial relationships between storm cells and terrain features
- Processing framework plugins enabling automated meteorological data batch analysis
- Real-time data connectors integrating live radar feeds directly into your mapping environment
- Python-scripted custom plugins that execute specialized atmospheric pattern recognition algorithms
You’re not locked into predetermined workflows. QGIS lets you architect precise analytical pipelines, combining topographic elevation models with radar overlays to interpret storm trajectories accurately and navigate hazardous terrain with calculated confidence.
GOES-16 and Remote Sensing Tools for Live Storm Assessment
When you’re conducting live storm assessments, GOES-16’s continuous global coverage gives you a critical advantage by delivering real-time atmospheric data with unmatched spatial resolution.
You can integrate this satellite data with radar feeds to build a multi-layered picture of storm structure, boundary conditions, and trajectory.
Cloud detection algorithms embedded in remote sensing software further sharpen your analysis by distinguishing storm edges from clear-sky regions with precise accuracy.
GOES-16 Satellite Coverage Benefits
Because it operates in geostationary orbit, GOES-16 delivers continuous, high-resolution imagery that’s critical for live storm assessment. You gain uninterrupted coverage over a fixed region, letting you monitor rapidly evolving storm structures without data gaps.
Key advantages include:
- Infrared imaging reveals temperature gradients across storm layers, exposing convective intensity with precision
- Cloud top temperature analysis identifies the highest, most vigorous updrafts within developing supercells
- Rapid scan mode delivers imagery updates every 30 seconds during active severe weather events
- Multi-spectral band data distinguishes storm boundaries, moisture plumes, and cirrus outflow simultaneously
These capabilities let you independently assess storm trajectory and intensity without relying solely on ground-based radar. Integrating GOES-16 data with radar analysis tools sharpens your situational awareness and supports faster, more accurate operational decisions during chases.
Remote Sensing Data Integration
Leveraging GOES-16 imagery gains full operational value when you integrate it with complementary remote sensing tools rather than treating it as a standalone data source. Combining multi-source satellite feeds lets you cross-validate storm boundaries, confirm convective development, and sharpen trajectory predictions.
Data calibration is critical here — uncalibrated inputs from disparate sensors introduce error margins that compound during rapid storm evolution. Apply consistent calibration protocols across all ingested feeds before analysis.
Image enhancement techniques, including contrast stretching and false-color compositing, extract structural details invisible in raw outputs. You’ll distinguish storm boundaries from cirrus interference more accurately when enhancement is applied systematically.
Pairing cloud detection algorithms with radar overlays further tightens your situational picture, letting you act on precise, multi-layered atmospheric assessments rather than fragmented single-source data during live chase operations.
Global Weather Models Storm Chasers Should Bookmark
Bookmarking the right global weather models can sharpen your situational awareness before and during a chase. Climate variability demands that you cross-reference multiple models to avoid over-relying on a single data source.
Data resolution varies markedly between platforms, so understanding each model’s limitations keeps your forecasting accurate.
Key models and tools worth bookmarking:
- GFS – Delivers global wind streamline data and reliable forecast model output
- Tropical Tidbits – Aggregates numerous global models with real-time integration for developing systems
- Windy – Visualizes wind streamlines across multiple forecast models intuitively
- CIMSS Tropical Cyclone Data – Provides worldwide cyclonic storm tracking information
Cross-referencing these resources against radar data gives you a thorough atmospheric picture, enabling sharper, faster decisions when severe weather develops rapidly.
Radar and Satellite Apps That Work Best Together
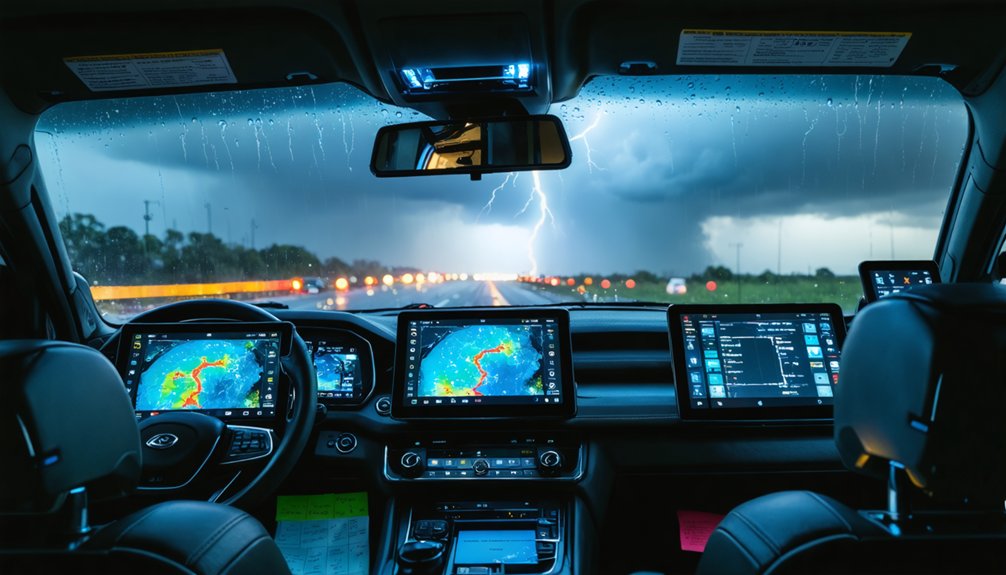
Global models sharpen your pre-chase planning, but real-time radar and satellite apps are what keep you oriented once a storm system is actively evolving. RadarScope delivers high-resolution radar data with precise storm structure detail, making it essential for reading supercell organization and rotation signatures.
Pair it with GOES-16 satellite imagery to layer atmospheric context over your radar returns, which directly addresses storm pattern complexity that single-source tools can’t resolve alone.
RadarOmega adds flexible visualization features that complement RadarScope’s core strengths, giving you multi-source cross-referencing to reinforce data accuracy during rapidly shifting conditions.
Tropical Tidbits bridges the gap between model output and live satellite feeds, letting you validate what the radar shows against broader synoptic trends.
Together, these tools form a tightly integrated observational workflow.
3D Visualization and Heatmap Tools That Give Chasers an Edge
When flat radar displays and two-dimensional overlays aren’t giving you the spatial depth you need, ArcScene fills the gap by rendering storm tracks and historical weather data in three dimensions.
Combined with heatmap clustering tools, you’re able to pinpoint high-risk zones through color gradients that visually encode storm intensity and frequency.
Data layering lets you stack radar returns, elevation models, and satellite imagery simultaneously, building a complete atmospheric picture.
Key advantages include:
- Three-dimensional storm track visualization for precise trajectory analysis
- Heatmap clustering to identify recurring severe weather corridors
- Color gradients distinguishing intensity thresholds across spatial datasets
- Digital elevation model integration for terrain-aware navigation decisions
These tools transform raw meteorological data into actionable spatial intelligence, keeping you strategically positioned during dynamic chase scenarios.
Frequently Asked Questions
What Training Is Needed to Effectively Use Meteorological Visualization Tools?
You’ll need strong data interpretation skills and software proficiency in tools like ArcGIS, RadarScope, and QGIS. Master radar analysis, satellite imagery, and spatial analytics through hands-on practice, online courses, and real-world storm chasing experience to excel independently.
How Much Do Professional Storm Chasing Visualization Tools Typically Cost?
Ironically, freedom isn’t free—you’ll find software licensing costs vary wildly. In your cost comparison, RadarScope runs ~$10/year, while ArcGIS licensing can exceed $1,500 annually. QGIS, however, liberates your budget completely—it’s free.
Can Visualization Tools Function Reliably in Areas With Poor Internet Connectivity?
Yes, you can rely on tools with offline capabilities like RadarScope, which cache critical data locally. Once connectivity’s restored, data synchronization updates your datasets, ensuring you’ve maintained accurate, uninterrupted storm analysis throughout low-connectivity environments.
How Do Storm Chasers Back up Their Data During Active Chase Operations?
While chaos surrounds you, you maintain control through data redundancy—simultaneously backing up radar captures and satellite imagery to cloud storage platforms and local drives, ensuring you never lose critical storm data during active chase operations.
Are There Legal Restrictions on Accessing Certain Meteorological Data Sources?
Yes, you’ll encounter data licensing agreements and access restrictions on certain meteorological sources. Commercial datasets like RadarScope require subscriptions, while government sources like GOES-16 remain openly accessible, so always verify licensing terms before integrating data operationally.
References
- https://weatherzone411.com/ultimate-guide-to-weather-tracking-software/
- https://www.atmosphericchaos.com/weather-resourses
- https://www.youtube.com/watch?v=rmTiSapVKlE
- https://apps.apple.com/dk/app/radarscope/id288419283
- https://livestormchasing.com/features
- https://crazystormchasers.com/geospatial-analysis-for-precise-risk-assessment-in-storm-chasing/
- https://www.reddit.com/r/stormchasing/comments/1qa9hh6/what_radar_app_do_storm_chasers_usually_use/
- https://mwm.ai/apps/wxl23/1171250052
- https://en.wikipedia.org/wiki/Storm_chasing
- https://www.weathergraphics.com/video/