Most U.S. tornadoes strike east of the Rocky Mountains, where the Great Plains, Midwest, Mississippi Valley, and southern states face the highest risk. Texas averages 123.8 tornadoes per year, while Kansas, Oklahoma, and Nebraska collectively account for nearly one-third of all U.S. tornadoes. You’re looking at roughly 1,200–1,274 annual tornadoes nationwide, with over 55% hitting between April and June. Keep exploring to uncover the full picture of where, why, and how often tornadoes threaten your region.
Key Takeaways
- Most U.S. tornadoes occur east of the Rocky Mountains, particularly in the Great Plains, Midwest, Mississippi Valley, and southern states.
- Tornado Alley—centered on Texas, Oklahoma, Kansas, and Nebraska—accounts for nearly one-third of all U.S. tornadoes annually.
- Texas leads all states with an average of 123.8 tornadoes per year, the highest total count nationwide.
- Florida ranks first in tornadoes per square mile, making it the densest tornado-risk state despite lower total counts.
- Over 55% of U.S. tornadoes occur between April and June, driven by increased wind shear and temperature contrasts.
Where Do Most Tornadoes Occur in the U.S.?
Most U.S. tornadoes occur east of the Rocky Mountains, with the highest concentrations in the Great Plains, Midwest, Mississippi Valley, and southern states. This geographic pattern isn’t random—cool, dry air from Canada collides with warm, moist Gulf air across the central U.S., triggering the supercell thunderstorms responsible for most tornadoes.
Cool Canadian air meets warm Gulf moisture across the central U.S., turning the skies into tornado territory.
Understanding this distribution strengthens both weather forecasting accuracy and tornado safety planning. The U.S. averages roughly 1,200 to 1,274 tornadoes annually, with over 55% striking between April and June.
Texas leads all states in total counts, averaging 123.8 tornadoes per year. Illinois and Mississippi follow closely.
You’re facing measurable risk across a broad central-to-southern corridor, not just isolated hotspots—so situational awareness and preparedness remain non-negotiable regardless of your specific location within that zone.
What Is Tornado Alley and Where Is It?
Within that broad central-to-southern corridor lies a more concentrated risk zone you’ve likely heard referenced: Tornado Alley. It’s not an officially designated boundary—it’s a climatological pattern centered on Texas, Oklahoma, Kansas, and Nebraska.
Together, those four states account for nearly a third of all U.S. tornadoes.
Climate influences drive this concentration. Cool, dry Canadian air collides with warm, moist Gulf of Mexico air across the flat central plains, creating ideal conditions for supercell thunderstorms and tornado formation.
That atmospheric conflict repeats consistently each spring and early summer, making the region statistically distinct from surrounding areas.
You should understand that Tornado Alley identifies elevated probability, not exclusivity. Significant tornadoes strike well beyond its loosely defined borders, spanning the broader Midwest, Mississippi Valley, and Deep South.
Which States Record the Most Tornadoes Each Year?
If you’re tracking raw tornado counts, Texas leads every other state, averaging roughly 124 tornadoes per year from 2021–2025.
You’ll find the next highest totals in central and southern states like Illinois, Mississippi, Kansas, and Oklahoma, which consistently rank near the top due to their position within the core storm corridor.
Keep in mind, though, that per-area risk tells a different story—Florida and Kansas outrank Texas in tornadoes per square mile, meaning total counts alone don’t capture where exposure is most concentrated.
Texas Leads Tornado Counts
You should understand that leading in total counts doesn’t automatically mean uniform risk statewide. Tornado safety priorities shift depending on your specific region within Texas.
Northern and central zones face the highest exposure, particularly during spring supercell outbreaks.
Still, Texas consistently ranks first nationally, making it the clearest benchmark for understanding U.S. tornado distribution.
If you live or travel there, factoring those numbers into your tornado safety planning remains a practical, data-backed decision.
Central States Follow Closely
While Texas leads the national count, several central states follow with figures that reinforce the region’s outsized tornado exposure. Illinois recorded 569 tornadoes from 2021–2025, edging out Mississippi’s 559 during the same period.
Kansas averaged 87 tornadoes per year, while Oklahoma posted 66 annually. These numbers align with historical tornado patterns showing persistent storm activity across the central corridor where cool Canadian air collides with Gulf moisture.
You’ll notice that tornado prediction models consistently flag this belt—spanning Kansas, Oklahoma, Nebraska, Iowa, and Missouri—as structurally prone to supercell development.
These states aren’t outliers; they’re confirmation of a repeating climatological cycle. Understanding their frequency data gives you a clearer picture of where tornado risk concentrates year after year beyond Texas’s dominant totals.
Per-Area Risk Varies
Raw tornado counts only tell part of the story. When you measure tornadoes per square mile, the rankings shift significantly. Florida, not Texas, ranked first in per-area tornado frequency according to NOAA data covering 1991–2010.
Kansas, Mississippi, Iowa, Oklahoma, and Alabama also posted high density figures despite lower total counts than Texas.
This distinction matters for tornado forecasting and personal preparedness. A smaller state with fewer total tornadoes can still expose you to greater per-area risk than a geographically massive state leading in raw numbers. Texas ranks lower per square mile than several smaller states.
Wherever you live in the tornado-prone corridor, storm shelter safety remains non-negotiable. Understanding density-based risk gives you a sharper, more accurate picture of your actual exposure.
The High-Risk Tornado Zones Beyond Tornado Alley
When you look beyond Tornado Alley, the southern and Midwestern states carry significant tornado risk that the data makes hard to ignore.
Illinois recorded 569 tornadoes from 2021–2025, while Mississippi logged 559 over the same period, placing both states ahead of traditional Tornado Alley members like Oklahoma in raw counts.
You’ll find that the tornado-prone corridor stretches well into Alabama, Missouri, and Iowa, forming a broad high-risk belt that extends far outside the four-state Tornado Alley core.
Southern States Tornado Risk
Beyond Tornado Alley, the southern United States carries a tornado risk that rivals—and in some metrics exceeds—the Plains states. Historical tornado patterns confirm that Mississippi recorded 559 tornadoes from 2021–2025, while Alabama consistently ranks among the most tornado-prone states nationally.
You can’t overlook Florida either—it ranked first in tornadoes per square mile for 1991–2010, despite rarely appearing in mainstream tornado discussions.
Climate change impacts are shifting southern tornado seasonality, extending risk windows beyond traditional spring peaks. The region’s vulnerability intensifies because tornadoes frequently strike at night and in heavily forested terrain, reducing warning effectiveness.
When you combine high population density with complex geography, the southern states present a tornado threat that demands the same serious preparation you’d apply anywhere in Tornado Alley.
Midwest High-Risk Areas
The Midwest doesn’t get the same headlines as Tornado Alley, but its tornado exposure is substantial and backed by hard numbers. Illinois recorded 569 tornadoes from 2021–2025, outpacing Kansas and Oklahoma in raw totals. Missouri and Iowa consistently appear in high-frequency rankings alongside their Plains neighbors.
The same atmospheric collision—cold Canadian air meeting Gulf moisture—that drives Tornado Alley activity extends directly into this region. You can’t treat Midwest tornado risk as secondary. Storm prediction models confirm repeated supercell development across this corridor each spring.
Tornado safety planning here demands the same urgency as anywhere in the central U.S. If you live in Illinois, Iowa, or Missouri, your risk profile reflects a persistent, data-supported pattern, not an occasional outlier.
Which States Have the Most Tornadoes Per Square Mile?
Raw tornado counts tell only part of the story—states with smaller land areas can face denser tornado exposure than high-count giants like Texas. Tornado climatology reveals that per-square-mile metrics shift the rankings considerably, giving you a clearer picture for storm prediction and personal risk assessment.
- Florida ranked first in tornadoes per square mile (1991–2010, NOAA data)
- Kansas, Mississippi, Iowa, and Oklahoma consistently rank high in density metrics
- Texas drops lower per square mile despite leading in total counts
- Alabama also appears among the densest tornado-exposure states
These density figures matter because your actual exposure depends on land area, not just statewide totals. A smaller state with concentrated tornado activity can present greater localized risk than a large state posting higher raw numbers.
Why the Central U.S. Breeds So Many Tornadoes
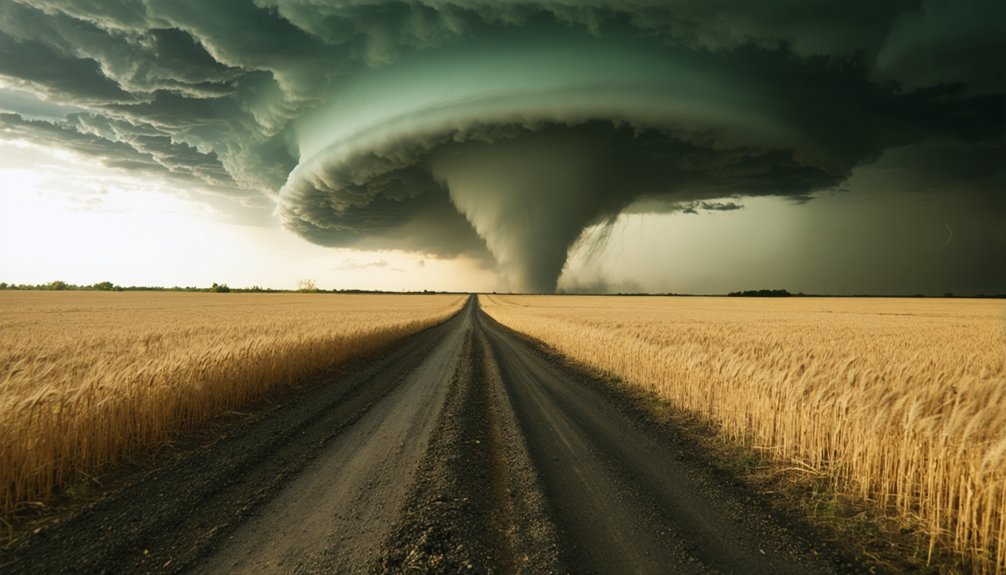
Few regions on Earth match the central U.S. for tornado frequency, and the geography explains why. You’re looking at a corridor where cool, dry air from Canada collides directly with warm, moist Gulf air, creating the atmospheric instability that drives tornado formation.
No mountain barrier interrupts that clash across the Great Plains, so supercell thunderstorms develop repeatedly through spring and early summer.
Climate patterns lock this cycle into place annually. More than 55% of U.S. tornadoes occur between April and June, precisely when temperature contrasts peak across this corridor.
The flat terrain accelerates wind shear, a critical ingredient for rotating storms. That combination of moisture, instability, and shear makes the central U.S. structurally different from other regions, producing roughly 1,200 to 1,274 tornadoes nationally each year, most concentrated here.
Why Spring and Summer Produce the Most Tornadoes
Spring dominates tornado season because temperature contrasts across the central U.S. hit their annual peak between April and June, driving more than 55% of all U.S. tornadoes into that three-month window. Tornado formation accelerates when specific weather patterns collide with precision.
- Cool, dry Canadian air pushes south while warm, moist Gulf air drives north, creating extreme atmospheric instability.
- Wind shear increases dramatically during spring, giving rotating thunderstorms the angular momentum they need.
- Daytime heating peaks in late spring, fueling supercell development across the Plains and Midwest.
- Summer shifts the tornado corridor northward as the Gulf moisture boundary migrates, redistributing activity.
You’re looking at a climatological engine that runs on contrast. When those air masses clash seasonally, tornado formation doesn’t slow — it surges.
Total Tornado Count vs. Per-Area Risk Explained
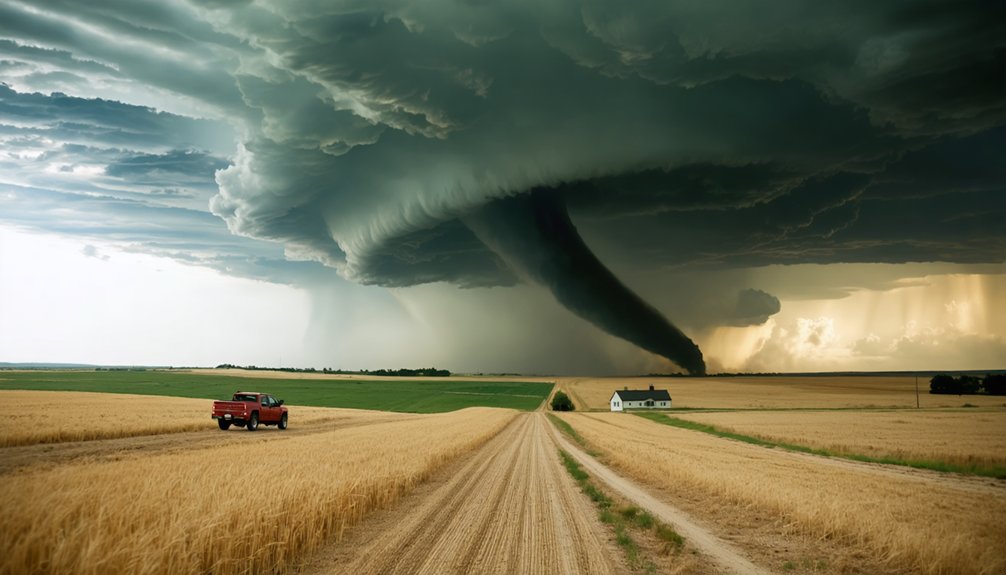
When you compare states by total tornado counts, the rankings shift sharply once land area enters the equation. Texas leads nationally in raw totals, averaging 103.2 tornadoes annually from 2020–2024, yet it ranks lower per square mile than several smaller states.
Florida, despite missing Tornado Alley entirely, ranked first in tornadoes per area from 1991–2010 using NOAA data. Kansas, Mississippi, Iowa, and Oklahoma all scored high in per-area frequency as well.
During tornado season, storm formation concentrates in smaller geographic windows, meaning compact states absorb disproportionate risk relative to their size. You need both metrics to accurately assess vulnerability.
Total counts reflect sheer volume; density measurements reveal where tornadoes genuinely saturate the landscape. Relying on only one figure distorts your understanding of true regional exposure.
Frequently Asked Questions
What Time of Day Do Most Tornadoes Typically Occur in the U.S.?
You’d least expect it—but tornado formation peaks between 3–9 PM. Weather patterns align dangerously as daytime heating maximizes instability, fueling supercells. You’re most vulnerable during late afternoon, when atmospheric energy reaches its explosive peak.
How Long Does the Average Tornado Last Before It Dissipates?
Most tornadoes you’ll encounter last under 10 minutes. Tornado formation and available wind shear directly control lifespan — weak tornadoes dissipate in seconds, while violent supercell-driven twisters can persist over an hour before finally losing energy.
Has the Number of U.S. Tornadoes Increased or Decreased Over Recent Decades?
While climate change hasn’t clearly increased tornado frequency, you’ll find detection improvements skew the data. Modern Doppler radar captures more weak tornadoes, inflating counts. Core violent tornado trends haven’t substantially risen over recent decades.
Can Tornadoes Occur During Winter Months in the United States?
Yes, you can experience tornadoes during winter months. Seasonal variations mean winter storms, particularly across the South, still generate tornado-producing supercells. However, you’ll find peak activity remains concentrated between April and June, exceeding 55%.
What Is the Deadliest Tornado Ever Recorded in United States History?
The 1925 Tri-State Tornado remains the deadliest in U.S. history, killing 695 people. You’ll find studying historical tornadoes essential for understanding tornado safety and reducing future fatalities across affected communities.
References
- https://en.wikipedia.org/wiki/Tornadoes_in_the_United_States
- https://science.howstuffworks.com/nature/natural-disasters/states-with-the-most-tornadoes.htm
- https://www.iii.org/fact-statistic/facts-statistics-tornadoes-and-thunderstorms
- https://www.worldatlas.com/natural-disasters/10-us-states-with-the-most-tornadoes.html
- https://usafacts.org/articles/beyond-tornado-alley-which-states-have-the-most-tornadoes/
- https://www.mentalfloss.com/geography/maps/states-with-the-most-tornadoes-map
- https://en.wikipedia.org/wiki/Tornado_Alley
- https://www.worldatlas.com/climate/the-most-tornado-prone-states-in-the-us.html
- https://www.aon.com/impactforecasting/attachments/UnitedStatesTornadoHistory.pdf
- https://en.wikipedia.org/wiki/Tornado_climatology