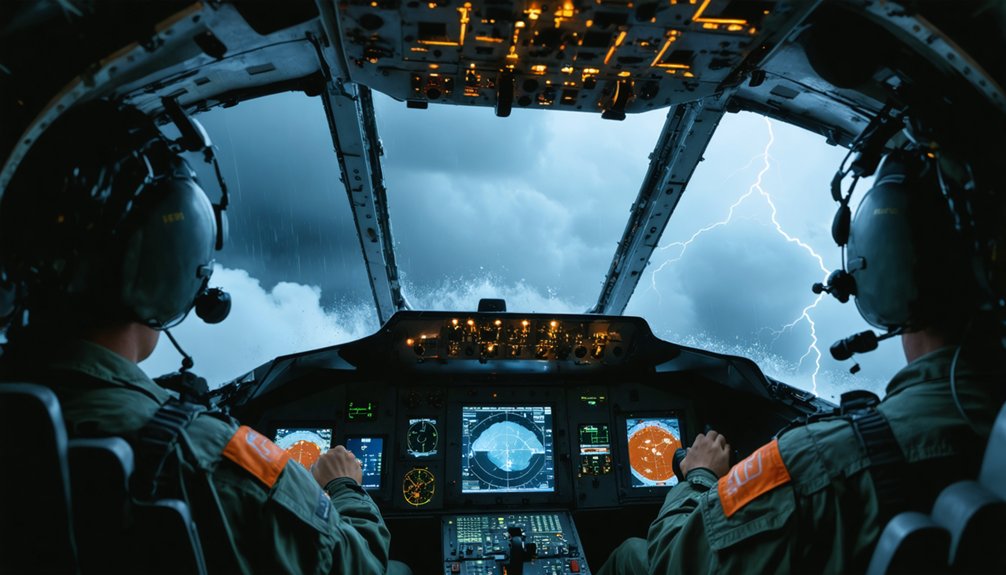
When you fly into a hurricane, seven airborne techniques give you data no ground system can match. You’ll use Tail Doppler Radar for 3D wind mapping, dropsondes for vertical atmospheric profiles, and flight-level wind observations for intensity fixes. Microwave sensors cut through clouds, while vertical wind profiling exposes boundary layer dynamics. Reconnaissance passes pin the exact storm center, and satellite-radar integration completes the picture. Each technique’s full capability runs deeper than you’d expect.
Key Takeaways
- Tail Doppler Radar scans hurricane wind fields three-dimensionally, delivering high-resolution updates every six minutes within a 200-kilometer range.
- Dropsondes capture temperature, pressure, humidity, and wind data during descent, providing continuous vertical profiles of the hurricane’s internal structure.
- Flight-level wind observations measure maximum sustained winds directly inside storms, fixing center location through wind shift analysis.
- Microwave sensors penetrate cloud cover and darkness, providing direct sea surface measurements essential for improving hurricane center predictions.
- Reconnaissance aircraft execute deliberate storm core passes, logging wind minimums, pressure levels, and maximum wind zones for precise tracking.
Tail Doppler Radar’s Cat-Scan View of Hurricane Wind Fields
The Tail Doppler Radar (TDR) mounted on hurricane reconnaissance aircraft delivers something no ground-based system can match: a rotating, three-dimensional scan of a storm’s complete wind field, from the ocean surface up to the stratosphere.
This Doppler technology functions like a cat-scan, slicing through the hurricane’s interior to reveal wind mapping data that ground stations simply can’t access.
You’re getting high-resolution updates every six minutes when the aircraft operates within range, capturing precise structural details across approximately 200 kilometers offshore.
The TDR’s rotating antenna continuously builds a volumetric picture of wind velocities, directions, and intensity gradients throughout the entire storm system, giving forecasters the actionable intelligence they need to make accurate, timely predictions about a hurricane’s behavior.
What Dropsondes Measure Inside a Hurricane’s Core
When a reconnaissance aircraft releases a dropsonde into a hurricane’s core, you’re deploying a parachute-equipped instrument package that captures temperature, pressure, humidity, and wind data as it descends through the storm.
That vertical descent gives you a continuous profile of the hurricane’s internal wind structure, exposing turbulence layers and boundary layer characteristics critical to forecast models.
You can then use this profiled data to estimate surface wind speeds, typically calculated at 90% of observed flight-level maximums.
Core Atmospheric Data Collection
Dropped from reconnaissance aircraft into a hurricane’s core, dropsondes collect vertical profiles of temperature, pressure, humidity, and wind as they descend on parachutes through the storm’s interior.
These measurements reveal critical atmospheric dynamics that satellite and radar systems simply can’t capture alone. You’re getting real-time data spanning the full vertical column—from flight altitude down to the ocean surface.
That vertical profiling identifies turbulence layers, boundary layer characteristics, and wind shear gradients essential for accurate hurricane prediction.
Forecasters use dropsonde data to estimate surface winds at approximately 90% of flight-level maximums, refining intensity assessments considerably.
Each instrument transmits continuously during descent, delivering a precise atmospheric snapshot that improves model initialization and sharpens your understanding of the storm’s true structural behavior.
Vertical Wind Structure Profiling
As dropsondes descend through a hurricane’s core, they construct a detailed vertical profile of wind behavior that reveals how speed and direction shift across discrete atmospheric layers.
You’re getting precise measurements of temperature, pressure, humidity, and wind simultaneously, creating a layered dataset that exposes where wind turbulence intensifies and where it dissipates.
The boundary layer—where the storm’s surface friction directly influences wind dynamics—receives particular scrutiny, since its characteristics determine how energy transfers between ocean and atmosphere.
Forecasters use this vertical data to estimate surface winds as approximately 90% of flight-level maximums, calibrating model inputs with greater accuracy.
Each dropsonde profile fundamentally hands you a cross-sectional blueprint of the storm’s internal mechanics, enabling sharper intensity forecasts and more reliable structural analysis.
How Flight-Level Winds Define Hurricane Intensity and Size
Flight-level wind observations cut through the ambiguity of remote sensing by placing instruments directly inside the storm. You get raw, unfiltered data on hurricane dynamics that satellite imagery simply can’t match.
Reconnaissance aircraft measure maximum sustained winds, decode wind patterns, and pinpoint storm structure with precision.
Flight-level data delivers critical intelligence:
- Maximum sustained wind speeds recorded at aircraft altitude
- Storm center location fixed using wind shift analysis
- Size and structural boundaries defined from edge-to-edge sampling
- Short-term intensity forecasts refined using real-time observations
- Bearing and range of peak wind zones logged for tracking systems
Specialists use these measurements to analyze intensity changes before landfall.
Point observations require turbulence corrections, but the resulting data gives you an accurate, actionable picture of the storm’s true power.
Why Microwave Sensors Read Sea Conditions Through Clouds and Darkness
While flight-level instruments capture wind data at altitude, they don’t tell the full story of what’s happening at the ocean surface below. That’s where microwave technology delivers a critical advantage. Microwave sensors penetrate cloud cover and operate regardless of daylight conditions, giving you direct measurements of sea surface state when optical systems fail completely.
These sensor capabilities let forecasters calculate wind speeds essential for hurricane center predictions, particularly at heights between 10,000 and 20,000 feet. Unlike visible or infrared satellite imagery, microwave instruments aren’t blocked by the dense convective clouds surrounding a storm’s eyewall.
You get accurate, independent data that directly improves model initialization, sharpening forecast accuracy before a storm threatens landfall. This operational independence makes microwave sensing indispensable within any serious hurricane reconnaissance program.
How Vertical Wind Profiling Exposes the Boundary Layer

Dropsondes, released from reconnaissance aircraft into a storm’s interior, give you something flight-level instruments fundamentally can’t: a continuous vertical profile of temperature, pressure, humidity, and wind from cruise altitude down through the boundary layer.
This vertical slice reveals boundary layer dynamics and turbulence characterization that surface estimates alone never capture.
Key profiling insights include:
- Identifies wind shear layers driving rapid intensity changes
- Exposes turbulence characterization across discrete atmospheric strata
- Maps boundary layer depth and moisture flux simultaneously
- Estimates surface winds at roughly 90% of flight-level maximums
- Flags inflow and outflow patterns controlling storm structure
You’re getting raw atmospheric truth, not modeled approximations.
That data feeds directly into initialization fields, sharpening forecast accuracy before a storm ever threatens landfall.
How Reconnaissance Aircraft Pin the Exact Hurricane Center
Pinning the exact hurricane center demands more than passive observation—reconnaissance aircraft execute deliberate passes through the storm core, recording the precise latitude, longitude, and time of minimum winds to establish a reliable fix.
You’re relying on technicians who log wind minimums, track wind shifts along the flight path, and measure the nearest standard pressure level’s minimum height. This data anchors your hurricane tracking operations to real coordinates rather than estimated positions.
Aircraft technology enables you to cross-reference these center fixes against Doppler radar returns and satellite imagery, sharpening position accuracy considerably.
The bearing and range of maximum winds get recorded alongside fix data, giving forecasters a complete spatial picture. That integration of airborne observations with external sources makes landfall prediction far more precise and operationally actionable.
How Satellite and Radar Data Complete the Reconnaissance Picture

Satellite imagery and Doppler radar don’t replace reconnaissance aircraft—they extend what aircraft data alone can’t deliver. When you combine flight-level observations with storm imagery and data integration from multiple independent sources, you build a complete operational picture no single platform achieves.
Key integrations that sharpen your storm analysis:
- Satellites track real-time cloud development and outer band structure
- Doppler radar maps precipitation intensity and inner-core structure near the coastline
- Aircraft data cross-references against satellite feeds to validate intensity estimates
- IoT sensor networks supplement gaps between reconnaissance flight passes
- Multi-source data integration tightens model initialization and landfall prediction accuracy
You’re not choosing between tools—you’re stacking them. Each layer removes uncertainty the others can’t address, giving forecasters the sharpest, most defensible picture of a storm’s true behavior.
Frequently Asked Questions
How Do Pilots Stay Safe While Flying Directly Into Hurricane Eyewalls?
You’d rely on specialized aircraft, rigorous training, and real-time data during eyewall penetration. Flight-level wind observations guide your entry angles, while dropsonde profiling identifies turbulence layers, ensuring pilot safety through precise, calculated navigation of the storm’s most violent zone.
What Aircraft Types Are Specifically Used for Hurricane Reconnaissance Missions?
Like iron birds cutting through chaos, you’ll find the WC-130J and WP-3D Orion dominate hurricane reconnaissance, each carrying specialized mission equipment and aircraft capabilities that transform raw storm data into life-saving forecasts.
How Long Does a Typical Hurricane Reconnaissance Flight Mission Last?
You’ll typically spend 8–12 hours airborne during a hurricane reconnaissance mission. Your flight duration depends on mission objectives, including dropsonde deployment, wind profiling, and radar scanning, ensuring you gather thorough storm data efficiently.
How Many Reconnaissance Flights Occur During a Single Hurricane Event?
During Hurricane Ian, you’d see hurricane flight frequency surge to 2–4 daily missions. Multiple crews rotate continuously, ensuring uninterrupted storm data collection. You’re never left without fresh reconnaissance data when it matters most.
What Training Do Meteorologists Receive Before Joining Hurricane Hunter Crews?
You’ll need rigorous meteorological education covering tropical cyclone dynamics, plus hands-on aircraft systems training. You’ll master dropsonde deployment, radar interpretation, and flight-level wind analysis before you’re cleared to fly operational hurricane reconnaissance missions.
References
- https://www.aoml.noaa.gov/observational-instruments/
- https://severeweather.wmo.int/TCFW/RAIV_Workshop2019/07_AircraftObservations_RobRogers.pdf
- https://www.nhc.noaa.gov/outreach/presentations/5_Hurricane_Hunter_Aircraft_Data_for_Tropical_Cyclone_Analysis_and_Forecasting_Past_Present_and_Future.pdf
- https://www.nhc.noaa.gov/outreach/presentations/nhc2013_aircraftData.pdf
- https://www.youtube.com/watch?v=hbYZwZZtRwY
- https://issnationallab.org/upward/tropical-cyclone-in-sight-tracking-hurricanes-typhoons-from-space/
- https://hurricanescience.org/science/observation/aircraftrecon/hurricanehunters/
- https://climavision.com/blog/how-are-hurricanes-tracked-tools-and-tips-for-superior-coverage/
- http://www.geotimes.org/july08/article.html?id=feature_hurricanes.html
- https://www.youtube.com/watch?v=sQv7W3wAkts