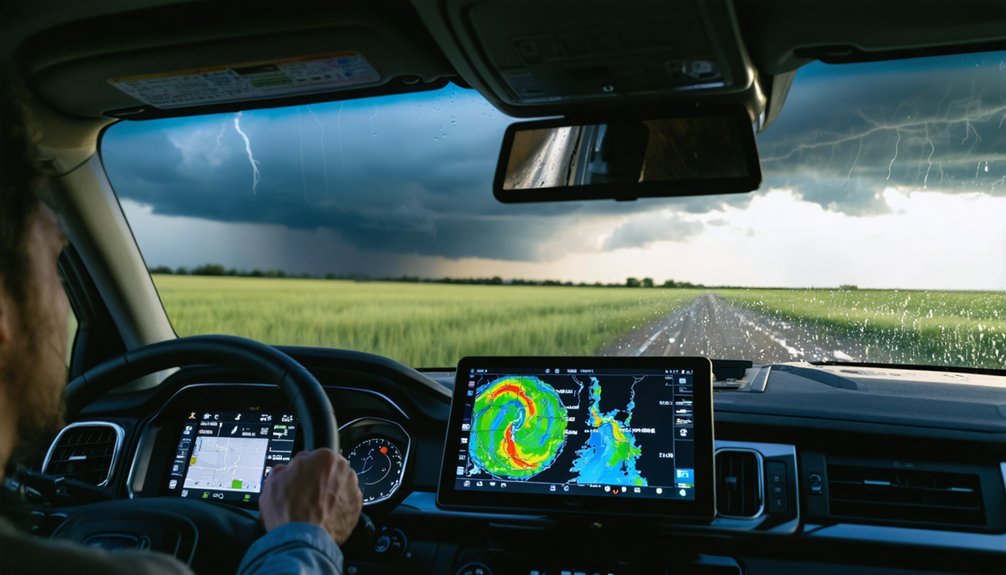
Doppler radar enhances storm monitoring by giving you two critical data streams simultaneously: reflectivity and velocity. Reflectivity reveals storm intensity, hail probability, and flood risk, while velocity data exposes internal wind motion, rotation, and mesocyclone development before tornadoes form. Values exceeding 50–60 dBZ signal hail likelihood, and gate-to-gate shear confirms dangerous rotation. Dual-pol technology even detects tornado debris objectively. Understanding each radar layer reveals a far more precise picture of how severe storms evolve.
Key Takeaways
- Doppler radar detects frequency shifts from moving precipitation, revealing wind speed, direction, and internal storm dynamics beyond standard radar capabilities.
- Reflectivity data measures storm intensity in dBZ, with values exceeding 50–60 dBZ indicating hail or flash flood potential.
- Velocity data identifies mesocyclone rotation and wind shear before tornado formation, enabling faster, more precise severe weather decisions.
- Hook echo signatures and velocity couplets confirm tornadic supercell organization, while dual-pol radar detects lofted debris confirming ground contact.
- Limitations like signal attenuation and blind zones are addressed through multi-angle scans, dual-pol algorithms, and machine learning models.
How Doppler Radar Reads Storms in Real Time
Doppler radar works by transmitting short pulses of radio energy and measuring the echoes that bounce back from precipitation, giving forecasters a near-real-time picture of storm size, shape, intensity, and movement.
You’re getting two critical data streams simultaneously: reflectivity, which maps precipitation location and estimates storm intensity, and velocity, which detects frequency shifts from moving raindrops and debris to reveal wind motion toward or away from the radar.
This data integration lets you analyze storm structure with precision, identifying rotation, hail cores, and rainfall rates without waiting for ground reports.
Modern systems refresh every few minutes, so you’re tracking storm evolution as it unfolds.
Combining reflectivity and velocity data together gives you the clearest, most actionable picture of what a storm is doing right now.
What Makes Doppler Radar Different From Standard Radar?
What separates Doppler radar from standard radar comes down to one critical capability: motion detection. Standard radar only tells you where precipitation exists and how intense it is.
Doppler adds frequency-shift analysis, so you’re seeing wind motion toward or away from the antenna in near real time. That distinction matters when you’re tracking rotating thunderstorms capable of producing tornadoes, dangerous storm surge, or deadly lightning strikes.
Standard radar shows you a storm’s location and reflectivity. Doppler shows you what’s happening inside it.
Velocity data lets forecasters identify mesocyclone development before a tornado touches down, extending warning lead time profoundly.
You’re not just reading a static snapshot—you’re analyzing a dynamic, data-rich portrait of atmospheric motion that empowers faster, more precise decisions when severe weather threatens.
How Reflectivity Data Reveals Storm Intensity and Hail
While velocity data tells you how air is moving inside a storm, reflectivity data tells you what’s there and how much of it exists. Measured in decibels of reflectivity (dBZ), this value quantifies how strongly precipitation scatters transmitted radar energy back to the antenna.
Reflectivity data reveals what lives inside a storm — and how much of it is there.
Higher dBZ values indicate denser, larger particles — a critical indicator of storm structure and intensity.
When reflectivity values exceed 50–60 dBZ within a storm’s core, hail formation becomes likely. Large hailstones scatter notably more energy than raindrops, producing distinctive high-reflectivity signatures that forecasters actively track.
Vertically, a towering reflectivity column pushing well above the freezing level confirms a powerful updraft capable of sustaining large hail. That single data layer gives you immediate, actionable intelligence about a storm’s threat potential.
How Radar Uses Rainfall Data to Monitor Flash Floods
When you analyze reflectivity data, you can estimate rainfall rates by correlating signal return strength with precipitation intensity, giving you a quantitative basis for flash-flood risk assessment.
You can then feed those estimates into monitoring systems that flag areas where accumulation thresholds are approaching critical levels.
As the storm evolves, radar updates every few minutes, letting you track rainfall progression in near real time and adjust flood warnings before conditions on the ground become dangerous.
Reflectivity Estimates Rainfall Rates
Reflectivity data does more than locate precipitation—it quantifies it. By analyzing returned signal strength, radar systems convert echo intensity into rainfall rate estimates using Z-R relationships, where Z represents reflectivity and R represents rain rate. You’re fundamentally reading storm microphysics through signal mathematics.
Stronger echoes indicate larger, more numerous droplets, translating directly into higher precipitation rates.
Forecasters examine precipitation patterns across spatial gradients to identify where rainfall accumulation is outpacing drainage capacity. Cells displaying reflectivity values exceeding 50 dBZ typically signal rainfall rates that can trigger flash flooding within minutes. You can track how quickly those values intensify, giving you actionable lead time.
When combined with basin topography and soil saturation data, reflectivity-derived rainfall estimates become a precise, operationally critical tool for flash-flood decision-making.
Flash Flood Monitoring Support
Flash flood monitoring transforms raw reflectivity accumulations into spatially resolved threat assessments by integrating radar-derived rainfall totals with hydrological models in near real time. You can track rainfall rates across drainage basins as storms evolve, identifying where accumulations exceed soil saturation thresholds.
When intense precipitation targets vulnerable urban infrastructure—aging stormwater systems, impervious surfaces, channelized waterways—radar data lets forecasters pinpoint runoff acceleration before flooding becomes catastrophic.
Climate change is intensifying precipitation extremes, compressing rainfall into shorter durations and overwhelming systems designed for historical norms.
Dual-pol variables refine liquid water estimates, reducing uncertainty in flood-triggering calculations.
National radar mosaics extend this capability across regions, supporting coordinated flash flood watches and warnings.
Real-time radar products refresh every few minutes, giving you actionable intelligence precisely when rapid decision-making matters most.
Radar Tracks Storm Evolution
Beyond quantifying rainfall accumulations, radar continuously tracks how storms evolve spatially and temporally, giving you a dynamic picture of precipitation patterns as they shift across a basin. Refreshed every few minutes, volumetric scans let you monitor cell mergers, dissipation, and intensification without delay.
Accurate radar calibration guarantees reflectivity values translate reliably into rainfall rates, eliminating systematic measurement drift that could distort your flood-risk assessment.
Dual-pol variables expose storm microphysics, distinguishing rain from hail and identifying liquid water content driving the heaviest precipitation cores.
You’re tracking not just where rain falls, but how storm structure changes in intensity and movement direction in real time. That evolving dataset lets you anticipate runoff surges before they materialize, giving you a critical decision-making edge during rapidly developing flash-flood events.
Velocity Data and What It Tells Forecasters About Wind
While reflectivity tells you where precipitation is, velocity data tells you how it’s moving—and that distinction is crucial for severe weather analysis. Doppler radar detects frequency shifts from moving precipitation particles, translating that data into wind speed and direction relative to the radar beam.
You’ll see inbound and outbound velocities displayed across the storm’s structure. When opposing velocities appear in close proximity, you’re looking at wind shear—a condition that drives rotation and signals atmospheric turbulence capable of producing violent updrafts.
Forecasters analyze these velocity couplets to identify mesocyclone development inside supercells.
Strong, tightly wound rotation persisting across multiple volume scans profoundly raises tornado probability. By combining velocity data with reflectivity, forecasters gain a precise, multi-dimensional picture of storm dynamics in near real time.
Hook Echoes, Mesocyclones, and Tornado Warning Signs
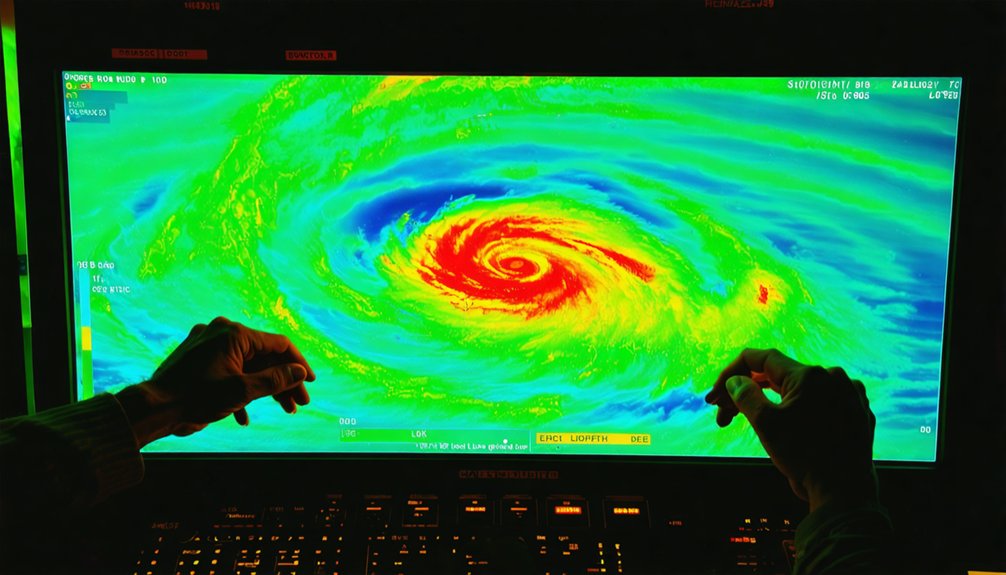
When you analyze reflectivity data, a hook echo — a curved appendage wrapping around a storm’s rear flank — signals that a mesocyclone is likely organizing precipitation around a rotating updraft.
You can cross-reference this pattern with velocity data to confirm rotation, looking for adjacent pixels showing strong inbound and outbound winds separated by a sharp gradient.
If that rotation is deep, persistent, and tightening across multiple elevation scans, you’re tracking one of radar’s strongest tornado precursor signatures.
Identifying Hook Echo Patterns
Hook echoes rank among the most recognizable and operationally significant signatures in storm monitoring. When you’re analyzing reflectivity data, the hook pattern appears as a curved appendage extending from a supercell’s southern or southeastern flank, indicating strong inflow and rotating updraft activity.
Signature identification requires you to examine the hook’s curvature, width, and position relative to the storm’s precipitation core. A tight, well-defined hook typically signals organized mesocyclonic rotation, elevating tornado probability markedly.
You’ll want to cross-reference velocity data simultaneously, confirming wind shear and rotational depth at multiple elevation angles. Precipitation wrapping around the circulation tightens the hook’s appearance over time.
Persistent hook structure across consecutive volume scans strengthens your confidence that a dangerous, tornado-capable supercell is actively developing.
Recognizing Mesocyclone Rotation Signals
Mesocyclone rotation signals demand your attention across both reflectivity and velocity products simultaneously, since no single dataset tells the full story.
Mesocyclone dynamics reveal themselves through tightening gate-to-gate shear values on velocity scans, where inbound and outbound winds appear in close proximity. You’ll want to track rotation amplification across multiple elevation angles, confirming whether the circulation extends deep into the storm’s vertical structure.
Shallow, weak rotation carries less weight than a persistent, strengthening signature spanning several tilts. Cross-reference velocity data against reflectivity to verify the mesocyclone’s position relative to any hook echo.
When low-level rotation intensifies rapidly and maintains continuity across successive volume scans, your confidence in tornadic potential increases substantially.
Time continuity remains your strongest analytical tool for distinguishing genuine mesocyclone development from transient shear artifacts.
How Radar Detects Tornado Debris With Dual-Pol Technology
Dual-polarization radar gives forecasters a powerful tool for confirming tornado presence by detecting the debris a violent vortex lofts into the atmosphere. When a tornado tears through structures, it throws irregular objects—boards, insulation, vegetation—into the circulation. These asymmetrical particles produce distinct dual pol signatures that differ sharply from rain or hail.
You’ll see correlation coefficient values drop markedly, often below 0.80, as tumbling debris scatters energy inconsistently. Simultaneously, differential reflectivity becomes erratic because irregular shapes don’t align predictably.
Together, these variables form a Tornado Debris Signature, giving you objective confirmation of ground contact even when rain wraps the circulation.
This capability proves critical at night or in rain-wrapped supercells, where visual confirmation is impossible. Dual-pol data removes ambiguity and sharpens your situational awareness precisely when it matters most.
Radar Detection Limits and Coverage Gaps
While dual-pol technology sharpens tornado confirmation, even the most advanced radar system carries hard geometric and physical limits that can leave dangerous circulations undetected. WSR-88D effectiveness drops sharply beyond roughly 63 statute miles, and mid-level circulations often go undetected within about 11.5 statute miles due to beam overshoot. A cone of silence directly above the antenna creates another blind zone you can’t ignore.
Signal attenuation compounds these gaps when heavy precipitation absorbs or scatters energy before it reaches the target circulation. Radar calibration errors further degrade velocity and reflectivity accuracy, undermining confidence in rotation intensity estimates.
Your strongest defense is cross-referencing multiple elevation angles across consecutive volume scans, since time continuity and multi-angle agreement remain the most reliable indicators when geometry and physics constrain raw detection capability.
How Technology Closes Radar’s Detection Blind Spots
Closing radar’s geometric blind spots requires layering multiple technologies that each target a specific failure mode. You can’t rely on a single WSR-88D installation when signal attenuation from heavy rain cores degrades returns or when the cone of silence swallows low-level data directly above the antenna.
Dual-polarization algorithms compensate by analyzing differential reflectivity and correlation coefficient, recovering structural information where raw reflectivity fails.
Machine learning models integrate velocity, spectrum width, and reflectivity across multiple elevation angles simultaneously, detecting rotation patterns a single-scan analysis would miss.
Rigorous radar calibration keeps transmitted power and received sensitivity within operational tolerances, preventing phantom echoes or missed signatures.
Aircraft-mounted Tail Doppler Radar supplements ground networks by generating three-dimensional wind cross-sections, directly filling coverage voids that fixed installations can’t resolve geometrically.
Why Radar Warning Lead Time Saves Lives

Every minute of advance warning directly affects whether people reach shelter before a tornado strikes. Doppler radar‘s signal processing converts raw frequency shifts into actionable velocity data within minutes, giving you critical time to respond before ground contact occurs.
Forecasters can issue tornado warnings when radar identifies organized low-level rotation, often several minutes before a funnel touches down. That lead time isn’t accidental—it’s engineered through precise radar calibration, which guarantees reflectivity and velocity measurements remain accurate under operational conditions.
When calibration drifts, warning thresholds become unreliable, directly compressing your available response window. Studies consistently show that each additional warning minute measurably reduces casualty rates.
Radar technology doesn’t just track storms; it quantifies threat evolution rapidly enough to protect your freedom to act before danger arrives.
Frequently Asked Questions
How Often Are Radar Systems Replaced or Upgraded Nationwide?
Radar maintenance cycles vary, but you’ll find upgrade schedules aren’t fixed nationwide. Agencies modernize systems based on funding, technology advances, and operational needs—dual-pol upgrades, for instance, rolled out over several years across WSR-88D network sites.
Can Doppler Radar Detect Tornadoes Occurring in Mountainous Terrain?
Yes, you can detect tornadoes in mountainous terrain, but terrain challenges considerably limit radar beam coverage. Mountains block low-level scans, creating blind spots that reduce mountainous detection accuracy, so you’ll often miss critical near-surface rotation data entirely.
How Do Forecasters Train to Interpret Complex Radar Signatures Accurately?
You’ll master radar interpretation through rigorous training methodologies combining simulated storm case studies, real-time data analysis, and dual-pol signature reviews—sharpening your ability to independently identify mesocyclones, hook echoes, and tornadic rotation across multiple elevation angles.
Are There Costs Associated With Accessing Real-Time Radar Data Publicly?
Like NOAA’s public radar portal, you’ll find most real-time radar data’s free. Cost analysis shows Data accessibility thrives through open-source platforms, letting you monitor storms without paywalls, preserving your freedom to access critical weather intelligence independently.
How Does Radar Data Get Shared Between Neighboring Forecast Offices?
You’ll find that data sharing protocols enable neighboring forecast offices to exchange radar feeds through inter-agency coordination networks, letting you access seamlessly integrated mosaics that merge multiple radar sources for all-encompassing, real-time storm coverage.
References
- https://www.weather.gov/nws/radar
- https://climeradar.com/blog/use-of-doppler-radar-in-storm-tracking
- https://www.weather.gov/media/abq/LocalStudies/TornadoDetection.pdf
- https://vlab.noaa.gov/web/nws-heritage/-/introducing-nexrad
- https://www.weather.gov/jan/dualpolupgrade-applications
- https://www.aoml.noaa.gov/real-time-doppler-radar/
- https://www.spc.noaa.gov/faq/tornado/doppler.htm
- https://crazystormchasers.com/why-are-doppler-radar-innovations-revolutionizing-storm-monitoring/
- https://www.meted.ucar.edu/ams/wim_2014/7b.html
- https://www.nssl.noaa.gov/education/svrwx101/tornadoes/detection/