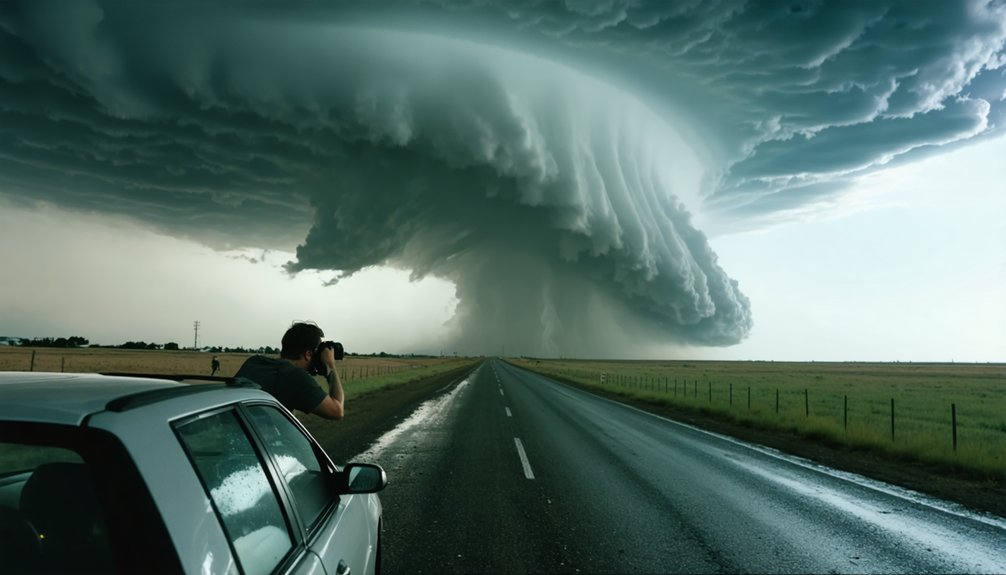
When reading weather radar for storm chasing, you’re interpreting reflected energy—not actual rainfall. Reflectivity is measured in dBZ, where 20 dBZ signals light rain and 65 dBZ indicates potential hail. Colors shift from blues and greens into reds and purples as intensity escalates. You’ll also use velocity products to spot rotation through green-red couplets. Pair these with animated loops to track storm movement and speed. There’s much more to uncover about using radar safely and effectively.
Key Takeaways
- Weather radar measures reflectivity in dBZ; light rain shows around 20 dBZ, while severe storms or hail exceed 65 dBZ.
- Colors indicate intensity: blues/greens mean light precipitation, while reds and purples signal dangerous heavy rain or hail cores.
- Always reference the color scale legend, as different radar platforms use varying calibrations affecting intensity readings.
- Use radar animation loops to track storm movement; divide displacement by elapsed time to estimate storm speed and direction.
- Cross-reference reflectivity with velocity data; adjacent green and red pixels indicate rotation and potential tornado-producing mesocyclones.
What Weather Radar Actually Measures for Storm Chasers
Weather radar doesn’t measure rain directly—it measures reflectivity, the energy bounced back to the antenna by raindrops, ice crystals, and hail. The return signal gets expressed in dBZ, a logarithmic unit that scales with precipitation intensity.
Around 20 dBZ indicates light rain; 65 dBZ suggests extreme intensity, likely involving hail.
You’re not seeing rain on screen—you’re seeing how much energy those hydrometeors reflect back. Small cloud droplets barely register because they return almost nothing. That’s why radar noise matters: weak, scattered returns near the baseline can mislead you if you skip data calibration checks.
Always verify the radar’s calibration status and timestamp before drawing conclusions. Raw reflectivity without that context gives you an incomplete, potentially dangerous picture during active storm observation.
The Reflectivity Color Scale Every Chaser Must Know
Once you understand that radar displays reflected energy rather than rainfall itself, the color scale becomes your primary diagnostic tool.
Reflectivity interpretation starts with knowing that each color maps directly to a decibel value. Blues and greens typically represent 10–30 dBZ, signaling light precipitation. Yellows and oranges push into 35–45 dBZ territory, indicating moderate to heavy rain.
Reds and purples climbing toward 55–65 dBZ demand immediate attention, often flagging intense rainfall or hail cores.
Color scale significance isn’t universal, though. Every platform uses its own palette, so always reference the legend before drawing conclusions.
A red echo on one app might correspond to a different dBZ threshold than on another. Cross-check the scale every time you switch tools, keeping your situational awareness sharp and your decisions grounded in actual data.
How to Read Reflectivity for Rain and Hail
Once you understand the color scale on your radar product, you can use reflectivity values directly to estimate precipitation intensity — greens around 20 dBZ indicate light rain, yellows signal moderate rainfall, and reds pushing into the 50s dBZ range point to heavy precipitation.
You’ll want to locate compact, high-intensity cores within the storm structure, as these concentrated cells often represent the most organized and severe convective activity.
When reflectivity climbs toward 65 dBZ or higher, you should treat that signature as a strong hail indicator and cross-reference it with the storm’s vertical structure and any available dual-pol data to confirm.
Understanding Reflectivity Color Scales
When you pull up a radar reflectivity image, the color scale is your primary tool for estimating precipitation intensity. Most scales run from blues and greens at the low end to reds and magentas at the high end.
Around 20 dBZ, expect light rain—barely worth tracking. By 40–45 dBZ, you’re looking at moderate to heavy rain intensity.
Once values climb past 55–60 dBZ, hail detection becomes a serious consideration, as those reflectivity levels often indicate large hydrometeors or mixed-phase precipitation.
At 65 dBZ or higher, treat the situation as potentially dangerous.
Always check the legend specific to your radar platform, because color assignments aren’t universal across services. Reading the scale accurately lets you make faster, more confident decisions in the field.
Identifying High Intensity Cores
High-intensity cores are the compact zones of elevated reflectivity embedded within a broader precipitation field, and knowing how to isolate them quickly separates useful radar reading from guesswork. Cloud composition directly influences how energy returns to the radar, so dense hydrometeor concentrations produce the highest dBZ readings.
When scanning precipitation patterns, focus on three indicators:
- Reflectivity thresholds above 50 dBZ suggest heavy rain or possible hail embedded in the cell.
- Compact circular or oval shapes within the echo indicate organized convective cores rather than stratiform spread.
- Color transitions from yellow to red or magenta mark boundaries where intensity escalates rapidly.
Cross-reference these cores against your leyenda to confirm the scale you’re reading. Don’t assume colors translate identically across platforms.
Spotting Hail With Reflectivity
Spotting hail inside a reflectivity image builds directly on reading high-intensity cores, because hail signatures push reflectivity values beyond what rain alone can produce. When you’re scanning a storm, watch for reflectivity thresholds exceeding 55 dBZ—that range signals probable large hail.
Values hitting 65 dBZ or higher indicate a serious hail threat and demand immediate attention.
Hail detection becomes more reliable when you correlate the intense core’s location with the storm’s updraft region. The strongest updrafts suspend large hailstones, concentrating extreme reflectivity values in a tight, compact area.
If you spot a bold red or magenta pixel cluster holding consistently high values across multiple radar frames, you’re likely looking at an active hail core. Always cross-reference your radar’s legend to confirm the exact dBZ scale you’re reading.
Velocity Radar: What Red and Green Actually Mean
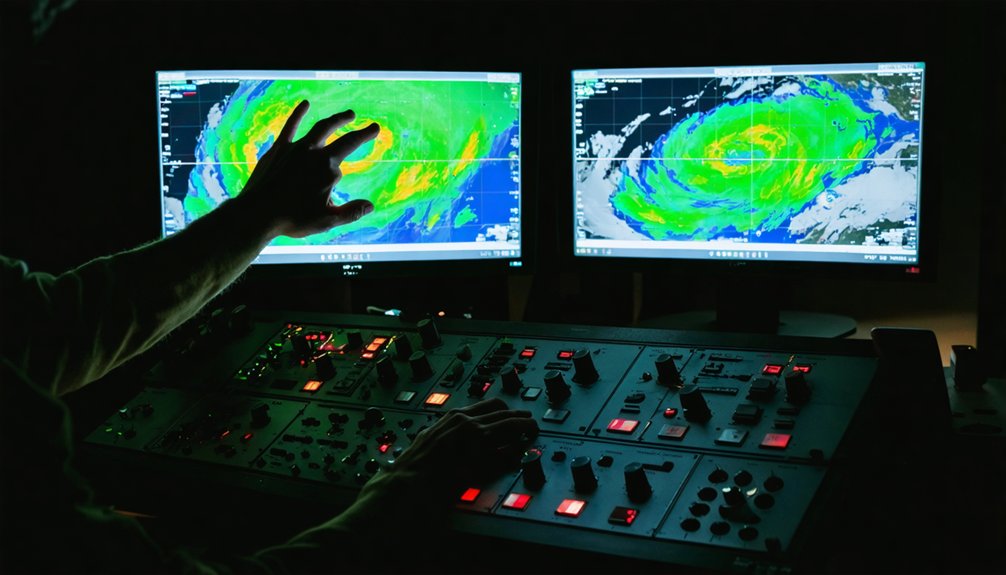
When you switch from reflectivity to velocity radar, you’re reading a fundamentally different product — one that measures motion, not precipitation intensity.
Red indicates precipitation moving away from the radar, while green indicates precipitation moving toward it.
Understanding this distinction keeps you from misreading velocity colors as storm strength indicators when you’re tracking rotation or wind structure.
Velocity Versus Reflectivity Explained
Most people assume red on weather radar always means danger, but on velocity products, color carries an entirely different meaning. Reflectivity measures returned signal strength, affected by radar polarization and signal attenuation. Velocity measures radial motion direction relative to the radar site.
Here’s what you need to distinguish:
- Reflectivity uses color to represent precipitation intensity in dBZ, where higher values indicate stronger returns.
- Velocity uses red to indicate targets moving away from the radar and green for targets moving toward it.
- Neither color system is interchangeable, and confusing them produces dangerously incorrect situational awareness.
When you overlay both products, you gain dual insight: where heavy precipitation exists and how it’s rotating. That combination is essential for identifying organized, potentially severe convective structure.
Red Means Moving Away
This distinction matters operationally. If you confuse velocity colors with reflectivity colors, you’ll misread rotation, wind shear, and storm structure entirely.
A red zone adjacent to a green zone indicates opposing movement — a signature that can reveal mesocyclone rotation inside a supercell.
Green Means Approaching Radar
Three critical reminders when reading green velocity returns:
- Green intensity doesn’t indicate rainfall strength — it reflects radial speed toward the radar only.
- Topography impact can distort readings; terrain blocking may suppress green returns near the radar’s blind zones.
- Adjacent green and red signatures within a single cell suggest rotation — a structurally significant warning sign.
You’re reading directional data, not intensity data. Confusing the two produces dangerous operational errors when you’re positioning yourself relative to an approaching storm.
How Animated Radar Reveals a Storm’s Direction and Speed
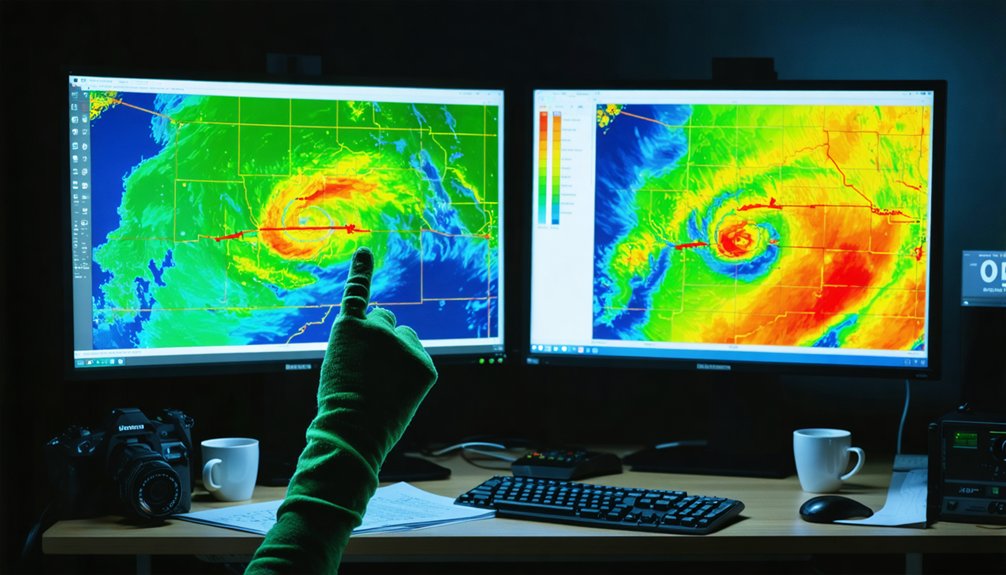
When you load an animated radar loop, you’re watching successive scan frames—typically updated every 2 to 6 minutes—stacked into a sequence that reveals how a storm cell translates across the map.
Track a reflectivity core across three or four frames, note its starting coordinates, measure its displacement, and divide by elapsed time to estimate ground speed. That calculation gives you a vector you can project forward for storm tracking purposes.
Track a reflectivity core across frames, measure displacement, divide by elapsed time—now you have a vector.
Faster loops compress time, making motion appear more dramatic, so always check the timestamp on each frame.
Cross-referencing cell movement with lightning patterns sharpens your situational awareness—if lightning activity intensifies as the cell accelerates toward your position, that’s operationally significant.
A single static image tells you nothing about trajectory; animation tells you nearly everything.
How to Spot Rotation and Storm Structure on Radar
Spotting rotation on radar requires switching from reflectivity to the velocity product, where color contrast does the heavy lifting. Adjacent green and red pixels in a tight area signal storm rotation — a potential mesocyclone worth tracking immediately.
To read storm structure effectively, focus on three indicators:
- Velocity couplet — a sharp green-red contrast within a compact zone confirms rotational wind shear inside the storm.
- Reflectivity core shape — hook-shaped or kidney-shaped echoes suggest organized convective storm structure and possible tornado development.
- High-reflectivity nucleus — values above 65 dBZ inside the rotation zone indicate hail or extreme precipitation intensity.
Combining both products gives you the clearest operational picture. Never rely on reflectivity alone when evaluating storm rotation or diagnosing storm structure in real time.
Where Free Radar Tools Fit Into Your Chasing Setup
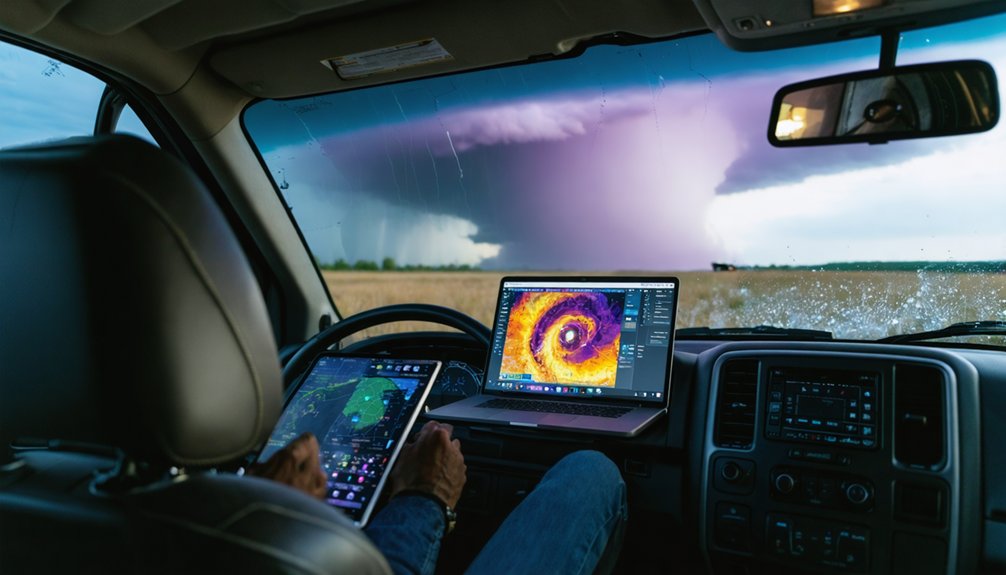
Reading rotation and structure on radar only pays off if you’re running reliable tools that give you current data without lag or gaps. Free radar platforms like RadarScope’s basic tier, RainViewer, or weather.gov give you access to reflectivity and velocity without subscription costs, which keeps your setup lean and mobile.
Reliable radar tools aren’t optional — they’re the foundation that makes reading rotation and structure actually mean something.
Use these tools to track precipitation patterns across your target area before you commit to a route. Understand that free tiers sometimes delay updates by several minutes, which matters when a cell is moving fast.
Radar calibration differences between sites also affect how accurately colors represent intensity, so always check the legend specific to each platform.
Pair free radar with a backup source. Single-tool dependence creates blind spots exactly when storm structure is changing fastest.
Radar Limitations That Can Catch Storm Chasers Off Guard
Even with solid tools in your setup, radar has hard physical limits that will burn you if you don’t account for them. Limitaciones técnicas cause real errores de interpretación when you’re moving fast and trusting outdated or incomplete data.
Three limitations you can’t ignore:
- Beam overshoot — At long distances, the radar beam rises above low-level storm features, hiding ground-level rotation or precipitation.
- Terrain blockage — Mountains and terrain create signal shadows, masking intense cores behind geographic obstacles.
- Scan delay — Most radar completes a full volume scan every 4–6 minutes. Storms evolve faster than that.
Cross-reference timestamps, check your distance from the nearest radar site, and never trust a single scan when you’re making positioning decisions in the field.
How to Combine Radar Products for Safer Storm Chasing
Knowing radar’s physical limits keeps you from getting burned by bad data — but working around those limits means stacking multiple radar products together rather than relying on any single view.
Cross-reference reflectivity against velocity data to confirm whether intense cores carry actual rotation or just signal attenuation masking weaker returns.
Radar calibration differences between stations mean a 55 dBZ reading on one network won’t always equal another’s — check the legend every time.
Run the animation loop to track storm movement, then layer velocity to detect rotation within that motion.
Where reflectivity shows a strong nucleus, velocity confirms whether it’s organized.
This three-product approach — reflectivity, velocity, animation — cuts interpretation errors and gives you actionable, real-time situational awareness before committing to any position relative to the storm.
Frequently Asked Questions
Can Weather Radar Detect Tornadoes That Have Already Touched Down?
radar doesn’t directly confirm tornado detection, but velocity data reveals rotation signatures. For post tornado analysis, you’ll cross-reference reflectivity and radial velocity to identify where touchdown likely occurred.
How Often Does Weather Radar Update Its Images in Real Time?
Most radar networks update every 2–10 minutes, depending on scan mode. You’ll get faster radar resolution during severe weather, as NEXRAD switches to volume coverage patterns optimized for precise storm tracking, giving you sharper, more frequent data.
Does Heavy Rain Always Appear the Same Color Across Different Radar Apps?
Like two guitarists playing the same note in different keys, heavy rain doesn’t maintain color consistency across apps. Radar calibration and scale choices vary, so you must always check each app’s legend before interpreting intensity.
Can Radar Tell You the Exact Size of Hail Inside a Storm?
Radar can’t give you exact hail size—it’s not built for that level of radar resolution. You can infer large hail from high reflectivity values, but precise hail size requires ground truth or dual-polarization data analysis.
Is Mobile Radar Used by Professional Storm Chasers Different From Public Radar?
Yes, it’s different. Professional chasers use mobile upgrades with dedicated dual-pol units, giving you superior data accuracy at close range. You’re capturing high-resolution, real-time scans that public radar networks simply can’t match in spatial detail.
References
- https://es.wikipedia.org/wiki/Radar_meteorológico
- https://www.youtube.com/watch?v=DqDlJFzOE7c
- https://www.aemet.es/es/eltiempo/observacion/radar
- https://www.youtube.com/watch?v=AeX2lMUfddQ
- https://www.neuralword.com/es/educacion-historia-ciencia-cultura-general-y-sociedad/ciencias-y-naturaleza/como-leer-el-radar-meteorologico-guia-practica-en-espanol
- https://www.aemet.es/es/eltiempo/observacion/radar/ayuda
- https://info-entrerios.com/como-leer-el-radar-tu-guia-practica-explicativa
- https://www.youtube.com/watch?v=igemKkhveoo
- https://www.youtube.com/watch?v=mWqFg21X2tE
- https://www.neuralword.com/pt/educacao-historia-ciencia-cultura-geral-e-sociedade/ciencia-e-natureza/como-ler-o-radar-meteorologico-guia-completo-e-pratico