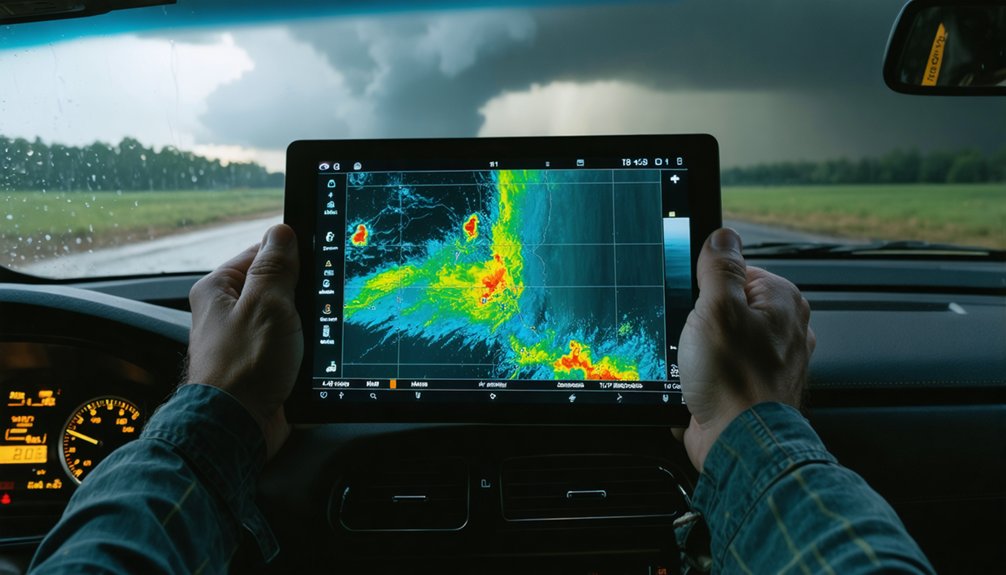
To master storm prediction, you’ll need to assess three core variables: instability, moisture, and lift using Skew-T diagrams and upper-air soundings. Cross-reference radar returns with satellite imagery and surface observations to confirm developing threats. Track barometric pressure continuously — a drop of 4 mb within three hours signals serious deterioration. When multiple data sources converge, you’ve moved from potential to confirmed threat. Explore further to sharpen your analytical edge.
Key Takeaways
- Analyze Skew-T diagrams and upper-air soundings to quantify atmospheric instability and identify moisture depth for accurate storm potential assessment.
- Sharp dewpoint gradients reveal critical air mass boundaries, signaling where convective triggers and storm development are most likely to occur.
- Cross-reference radar returns, satellite imagery, and soundings to confirm storm initiation and verify vertical wind structure comprehensively.
- Monitor barometric pressure every 30 minutes; a drop exceeding 4 mb in three hours signals significant, imminent storm deterioration.
- When radar, soundings, pressure trends, and satellite imagery converge, transition immediately from potential assessment to actionable storm threat response.
Read Instability, Moisture, and Lift for Storm Potential
When evaluating storm potential, you’ll need to analyze three core ingredients simultaneously: instability, moisture, and lift. Start with upper-air soundings and Skew-T diagrams to quantify atmospheric instability—unstable air accelerates convective triggers that drive rapid cloud development.
Next, assess moisture depth and dewpoint gradients. High dewpoints confirm available fuel, while sharp gradients identify critical boundary interactions where contrasting air masses converge. These boundaries frequently focus storm initiation.
Finally, identify your lift mechanisms. Wind shift lines mark boundaries first, then refine your analysis using temperature and moisture gradients. Frontal systems, drylines, and terrain forcing all provide the low-level convergence needed to force warm, moist air upward.
Combining these three diagnostics gives you a precise, data-grounded picture of whether conditions truly support significant convection.
Combine Radar, Soundings, and Observations to Confirm Storm Threats
Diagnosing instability, moisture, and lift builds your conceptual framework, but you still need real-time data to confirm whether those ingredients are actually converging into a genuine storm threat. Cross-reference radar returns with upper-air soundings to assess vertical wind structure and cap erosion simultaneously.
Soundings reveal moisture profiles and stability indices; radar confirms whether convection is actually initiating. Integrate satellite imagery to track cloud-top temperatures and identify where boundaries are focusing lift.
Your boundary analysis should update every two hours minimum—wind shift lines evolve quickly, and outdated boundaries produce missed threats. Surface observations add ground-truth that models often lag behind.
When radar, soundings, satellite imagery, and surface data all align, you’ve moved beyond theoretical potential into confirmed, actionable storm recognition.
Track Pressure Drops Before a Storm Hits
How fast the barometer falls tells you as much as how far it drops. Monitor pressure trends continuously, not just at fixed intervals. A fall of 4 mb or more within three hours signals serious deterioration.
If you’re seeing drops exceeding 1.0 mb per hour, treat that as an incoming storm indicator requiring immediate action.
Rapid changes in pressure compress your decision window significantly. Don’t wait for visual confirmation—by the time clouds organize visibly, you’ve already lost preparation time.
Log readings every 30 minutes during active weather to catch acceleration in the pressure fall rate.
Cross-reference pressure trends against your wind and moisture data. Converging signals across multiple parameters sharpen your threat assessment and let you act decisively before conditions deteriorate beyond safe operational thresholds.
Frequently Asked Questions
How Does Wind Shear Influence the Organization of Severe Storms?
Wind shear directly drives storm organization by structuring vertical wind profiles. You’ll find it separates updrafts from downdrafts, enabling sustained rotation. Combine wind shear data with soundings and radar to analyze severe storm potential effectively.
How Often Should Boundary Analyses Be Updated for Accurate Storm Tracking?
Update boundary analyses every two hours—miss one cycle, and you’ll lose critical storm-tracking continuity. You must integrate satellite imagery and atmospheric modeling constantly, ensuring your data stays razor-sharp and your forecasts remain free from dangerous blind spots.
What Role Do Dewpoint Gradients Play in Identifying Storm Boundaries?
Dewpoint gradients help you pinpoint storm boundaries by revealing sharp moisture contrasts in the atmosphere. When you track these gradients, you’ll identify convergence zones where thermal and moisture conditions combine, confirming boundaries that’ll likely focus and support significant convective storm development.
How Can Terrain Features Act as Lifting Mechanisms for Storm Initiation?
Ironically, the very ground beneath you triggers the sky’s fury—terrain forces air upward through orographic lift and terrain-induced convergence, compelling moist, unstable parcels to rise, cool, condense, and release the convective storms you’re analyzing.
Why Is Clear Team Communication Critical During Rapidly Changing Weather Conditions?
Clear team coordination lets you act on rapidly shifting data before conditions deteriorate. You’ll need established communication protocols to relay pressure drops, boundary shifts, and radar updates instantly, ensuring everyone’s response aligns with the latest atmospheric analysis.
References
- https://www.nautinst.org/resources-page/mastering-the-weather.html
- https://www.nssl.noaa.gov/education/svrwx101/thunderstorms/forecasting/
- https://www.youtube.com/watch?v=yFA9N6VPebU
- https://ral.ucar.edu/technologies/forecasting-systems
- https://www.worldstormcentral.co/pdf/PREDICTING STORMS – The Adventure Begins Third Edition (PDF).pdf
- https://www.weather.gov/media/zhu/ZHU_Training_Page/Met_Tutorials/Meteorological_Techniques.pdf
- https://repository.library.noaa.gov/view/noaa/7058/noaa_7058_DS1.pdf
- https://www.numberanalytics.com/blog/mastering-storm-prediction-guide
- https://crazystormchasers.com/predicting-severe-weather-atmospheric-analysis-storm-chasers/