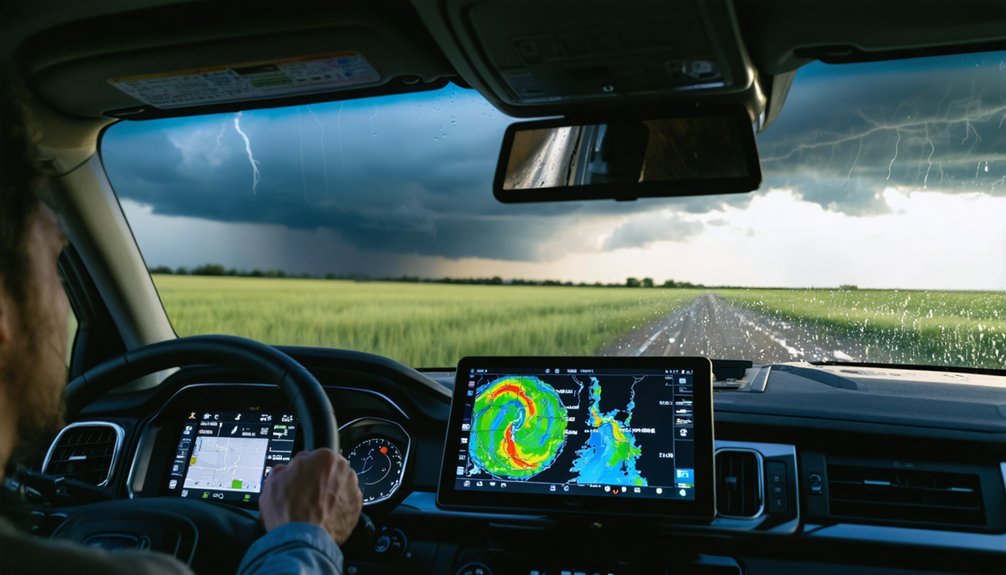
Real-time storm monitoring requires you to layer multiple data sources simultaneously — radar overlays, pressure readings, velocity signatures, and basin-specific variables all at once. You’ll rely on NHC for authoritative wind classifications, NWS radar for Doppler velocity products, and NOAA Clime for push alerts and satellite imagery. Set your alert thresholds before storms are even named, and cross-reference reflectivity with wind data to maintain safe positioning. Everything covered ahead sharpens your operational edge considerably.
Key Takeaways
- The NHC, NWS Radar, and NOAA Clime app are essential primary sources for real-time storm tracking, wind data, and severe weather alerts.
- Strategic app stacking—combining radar, timing, and wind tools—ensures comprehensive situational awareness during active storm monitoring.
- Overlaying reflectivity (dBZ) and velocity data provides critical insights into storm intensification, rain bands, and hurricane core structure.
- Configure push alerts at disturbance appearance, not storm naming, to stay ahead of rapid intensification and dangerous escalation.
- Key safety thresholds include pressure below 980 mb, sustained winds above 74 mph, and gusts exceeding 58 mph for repositioning decisions.
What You Actually Need Before Chasing a Storm
Before you chase a single storm, you need a verified stack of tools and data sources that give you accurate, real-time situational awareness. Storm tracking without reliable inputs isn’t chasing—it’s gambling.
Start with the National Hurricane Center for authoritative wind speed data and tracking maps. Layer in NWS radar for live precipitation and alert overlays. Use NOAA’s Clime app for location-specific radar imagery and push notifications. Install FEMA’s app for shelter coordinates and evacuation data.
Your data stack starts with NHC, NWS radar, NOAA’s Clime app, and FEMA—build it before you move.
Weather prediction accuracy depends on cross-referencing multiple platforms, not trusting one. Pull five-day NOAA outlooks for route planning. Monitor pressure thresholds and Saffir-Simpson classifications before closing distance on any system.
Your data stack determines your margin of safety—build it deliberately.
NOAA Radar Tools That Track Rain, Lightning, and Hurricanes
When you access NOAA’s live radar maps, you’re pulling real-time overlays that simultaneously track rain intensity, lightning strikes, and active hurricane systems within a single interface.
You can layer severe weather data—including lightning detection and hurricane monitoring—on top of base radar to sharpen your situational awareness before and during a chase.
If you’re building a custom tracking application, NOAA’s OGC-compliant services let you integrate these radar products directly into your own pipeline for precision storm analysis.
Live NOAA Radar Capabilities
Whether you’re tracking a developing hurricane or monitoring a fast-moving thunderstorm, NOAA’s live radar tools give you a real-time operational edge. The platform delivers high radar resolution across multiple severe weather layers, letting you isolate rain bands, lightning strikes, and hurricane cores within a single interface.
You can analyze storm velocity data to calculate how quickly a system is intensifying or shifting direction, which directly informs your positioning decisions.
OGC-compliant services let you integrate these radar products into custom applications, giving you flexibility beyond standard interfaces.
Future radar timelines extend your situational awareness by projecting storm progression hours ahead.
Combined with pressure and wind speed thresholds, NOAA’s live capabilities transform raw atmospheric data into actionable intelligence you can execute in the field.
Lightning and Hurricane Layers
NOAA’s severe weather layers let you isolate lightning detection and hurricane monitoring within a single radar interface, eliminating the need to toggle between separate platforms.
By overlaying lightning patterns directly onto live radar, you can identify electrical activity within developing storm cells before rotation intensifies. This integration gives you precise situational awareness without fragmenting your attention across multiple tools.
For hurricane tracking, these layers display hurricane categories in real time using Saffir-Simpson Scale classifications, letting you assess wind thresholds and adjust your positioning accordingly. You’re not guessing—you’re working from validated, continuously updated data.
Combining lightning pattern density with categorical storm intensity creates a composite operational picture that supports faster, more accurate decisions. That’s the kind of analytical leverage serious storm chasers need in the field.
OGC Integration for Chasers
Layered radar intelligence only gets you so far if you can’t pipe it into your own workflows. That’s where OGC standards change everything.
NOAA’s radar products support OGC-compliant services, meaning you can pull live precipitation, wind, and hurricane data directly into custom-built tracking applications without depending on third-party interfaces.
This data interoperability breaks you free from rigid app ecosystems. You define the display parameters, overlay combinations, and alert thresholds that match your specific chasing strategy.
Connect NOAA’s Web Map Services into GIS platforms, Python pipelines, or mobile dashboards you control entirely.
The technical advantage is precision. You’re not filtering through someone else’s UX decisions—you’re ingesting raw, authoritative feeds and building situational awareness on your terms.
That’s operational freedom most chasers haven’t tapped yet.
Which Apps Win for Live Storm Chasing?
Four apps stand out when you’re building a live storm-chasing toolkit. Clime leads with NOAA-based radar, satellite imagery, and severe weather alerts in one unified interface. Its data integration pulls NWS feeds directly, giving you authoritative, low-latency storm positioning.
Storm Radar extends your planning window with longer future-radar loops, critical when you’re projecting intercept routes hours ahead.
AccuWeather sharpens your timing with four-hour precipitation windows, letting you nail exact storm arrival down to the minute.
Windy.app wins for coastal operations, delivering high-resolution marine wind layers that standard apps don’t match.
Each tool targets a specific operational gap. Stack them strategically rather than relying on one platform, and you’ll maintain situational awareness across radar, timing, and wind routing simultaneously.
How to Read NOAA Radar Layers Like a Pro
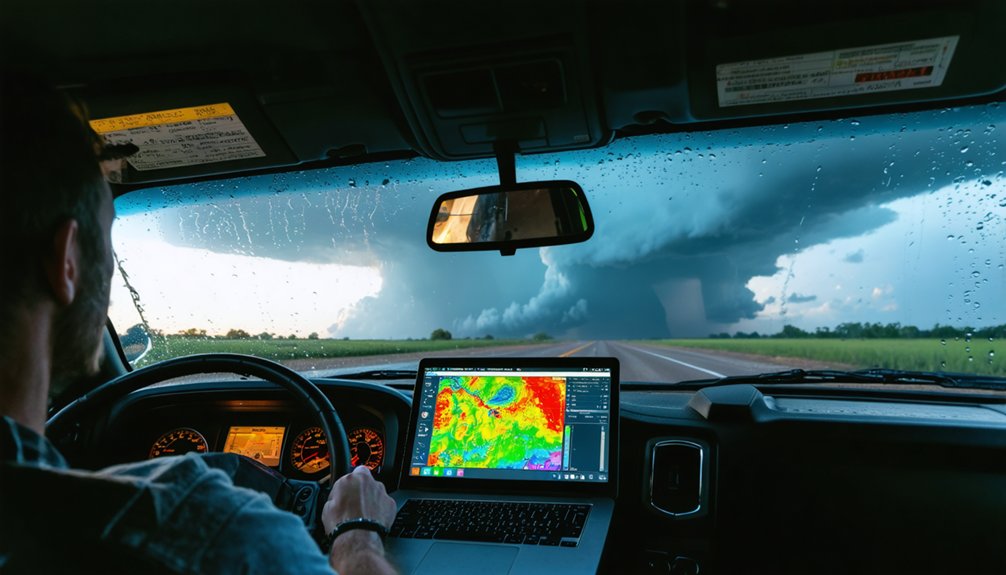
When you interpret NOAA radar layers, you’re reading a color-scaled reflectivity spectrum where greens indicate light precipitation, yellows signal moderate intensity, and reds flag severe rainfall or rotation.
You’ll activate severe weather overlays within apps like Clime or Storm Radar to isolate lightning strikes, hook echoes, and mesocyclone signatures simultaneously.
Cross-referencing wind shear data against precipitation density lets you calculate storm intensity thresholds and determine safe observation distances with precision.
Understanding Radar Color Scales
Reading NOAA radar color scales correctly separates effective storm tracking from dangerous guesswork. Each color gradient represents reflectivity values measured in dBZ, indicating precipitation intensity. Blues and greens signal light rain, yellows indicate moderate rainfall, while reds and purples mark severe precipitation and potential hail cores.
Radar calibration directly affects how accurately those colors reflect actual storm intensity. A miscalibrated radar skews the gradient, causing you to misread a dangerous cell as manageable. Always cross-reference multiple radar sources to verify consistency.
Purple returns above 65 dBZ demand immediate attention — they typically indicate large hail or extreme rainfall rates.
Train yourself to identify gradient transitions rapidly. Quick, accurate color interpretation lets you make faster routing decisions and maintain safe observation distances during dynamic, fast-moving storm events.
Identifying Severe Weather Layers
Mastering NOAA’s severe weather layers transforms raw radar data into actionable intelligence. You’re not just watching precipitation—you’re reading a multi-dimensional threat environment.
Stack your layers strategically: base reflectivity reveals storm structure, velocity data exposes rotation, and lightning detection pinpoints electrification zones indicating explosive development.
Layer customization separates amateur observers from disciplined chasers. Toggle severe weather overlays selectively—running every layer simultaneously creates visual noise that slows critical decisions.
Prioritize rotation and storm-relative velocity when targeting supercells. Switch to wind and pressure layers when monitoring hurricane approach corridors.
OGC-compliant platforms let you build custom layer configurations saved for rapid deployment. You control the data architecture.
When conditions escalate, your pre-configured severe weather stack delivers immediate situational awareness without wasted navigation time.
Interpreting Wind And Precipitation
Wind and precipitation data tell completely different stories on NOAA radar, and conflating them kills situational awareness. Precipitation intensity appears through reflectivity returns—measured in dBZ—where greens indicate light rain, yellows signal moderate, and reds flag heavy rainfall or hail cores.
Don’t misread high reflectivity as wind speed; they’re separate data streams entirely.
Wind patterns require velocity products, specifically Base Velocity or Storm Relative Motion layers. These display Doppler-derived wind fields using inbound and outbound color gradients. Green moves toward the radar; red moves away. A tight couplet of adjacent green and red indicates rotation—your critical tornado signature.
Layer-switch deliberately. Run reflectivity first to locate the storm core, then toggle velocity to assess rotational dynamics. Mixing these interpretations mid-analysis compromises your positioning decisions and safety margins.
Track Hurricanes With the National Hurricane Center
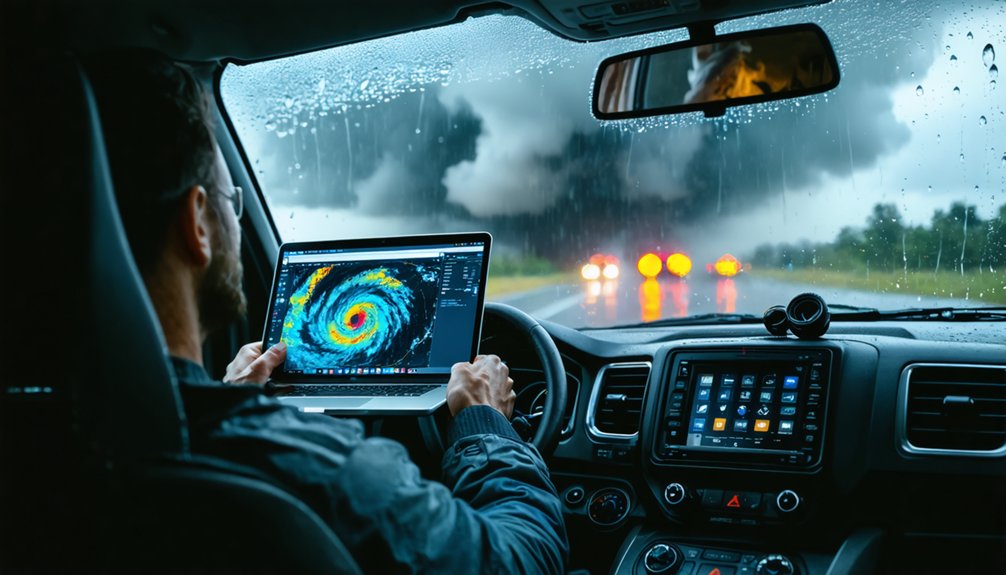
When you need authoritative hurricane data, the National Hurricane Center website is your definitive source for tracking maps, wind speed metrics, and basin-specific storm developments. You’ll access satellite imagery updated continuously, letting you analyze convective banding, eye wall structure, and intensification trends independently.
Cross-reference wind speed data against the Saffir-Simpson Scale to classify storm intensity and calculate safe observation thresholds before positioning. Monitor storm surge projections alongside pressure readings to assess coastal inundation risk across specific impact zones.
Cross-reference wind speed data against the Saffir-Simpson Scale to assess storm intensity and coastal inundation risk before positioning.
The NHC covers Atlantic, Eastern Pacific, and Central Pacific basins, giving you all-encompassing tropical monitoring across all active regions. Activate five-day outlook forecasts to plan strategic approach routes before landfall windows tighten.
This platform eliminates guesswork, delivering the precision you need to make autonomous, data-driven decisions in dynamic storm environments.
Atlantic vs. Pacific Basin: Where Storm Chasers Should Focus
Choosing between the Atlantic and Pacific basins fundamentally shapes your operational strategy, gear loadout, and logistical planning as a storm chaser. Basin comparison reveals distinct storm season windows, access challenges, and intensity patterns you can’t ignore.
Key factors driving your basin decision:
- Atlantic basin records stretch back to 1851, giving you unmatched historical data for pattern recognition and route planning.
- Eastern Pacific basin produces more frequent storms but limits land-based intercept opportunities due to coastal geography.
- Central Pacific basin delivers lower storm volume, demanding precise timing and resource commitment from mobile chasers.
Your freedom depends on data-driven decisions. Use NWS regional zones, NOAA historical search tools, and five-day outlooks to position yourself where storm season activity maximizes your intercept potential.
Set Up Push Alerts Before the Storm Hits
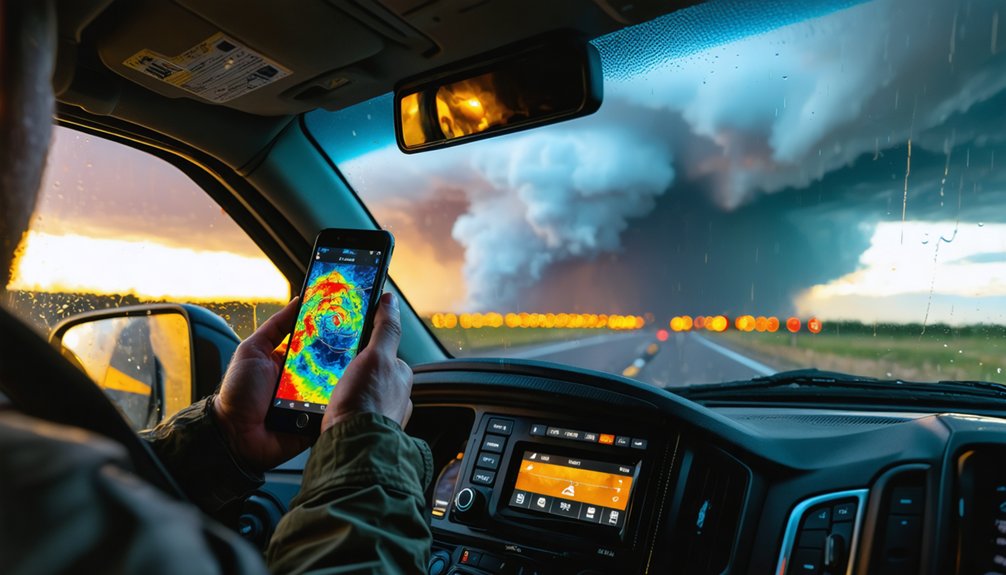
Setting up push alerts before a storm develops isn’t optional—it’s the operational foundation that keeps you ahead of rapid intensification events. Configure notifications across multiple platforms—FEMA, NOAA Clime, and NWS—to guarantee redundancy when one system lags. Each app targets different data streams, so layering them enhances your storm preparedness posture considerably.
Prioritize alerts tied to pressure drops and wind speed thresholds, since those metrics signal dangerous escalation faster than visual radar alone. Don’t wait for a named storm—activate alerts when disturbances first appear in basin outlooks.
Your safety protocols depend on receiving data before conditions deteriorate, not during. Customize alert sensitivity by region, storm type, and severity tier. Early configuration gives you decision-making freedom when it matters most—before the window closes.
Pressure and Wind Thresholds That Define Safe Observation Distance
Alerts get you moving—but pressure and wind data tell you exactly how close you can get. Monitor pressure thresholds and wind safety metrics continuously—they’re your boundary markers in the field.
- Below 980 mb pressure: Rapid intensification is likely. Increase your distance immediately—conditions can deteriorate within minutes.
- Sustained winds above 74 mph: You’ve entered hurricane-force territory. Debris becomes lethal, and vehicle control fails.
- Wind gusts exceeding 58 mph: Structural damage begins here. Reposition before gusts escalate further.
Your apps display these metrics in real time. Cross-reference NWS pressure data with live wind speed layers on Clime or Storm Radar. Don’t guess—let the numbers dictate your position.
Freedom in storm chasing means knowing exactly when to hold ground and when to move.
Frequently Asked Questions
Can Storm Chasers Legally Access Private Land During Active Tornado Events?
You can’t access private land without explicit land permissions, even during active tornado events. Public access laws don’t override property rights, so always secure prior authorization from landowners before positioning yourself on their property.
What Insurance Coverage Do Professional Storm Chasers Typically Carry During Operations?
“Better safe than sorry” — you’ll typically carry liability coverage for vehicle damage, equipment loss, and third-party injuries. Insurance requirements vary, but all-encompassing auto, gear, and general liability policies protect your freedom to chase without financial ruin.
How Do Storm Chasers Communicate With Each Other in the Field?
You’ll rely on VHF/UHF radios, mobile apps, and GPS-sharing platforms for radar coordination with your team. You’re maintaining safety protocols through real-time voice communication and data syncing, ensuring everyone’s tracking identical storm positions simultaneously.
Are There Certification Programs Available for Aspiring Professional Storm Chasers?
Chasing dark, churning skies demands preparation. You’ll find certification programs through universities and storm chasing organizations that sharpen your weather prediction tools knowledge and ground you in storm chasing ethics, giving you freedom to pursue storms responsibly.
How Does Nighttime Storm Chasing Differ From Daytime Chasing Strategies?
Nighttime visibility severely limits your visual storm assessment, forcing heavier reliance on radar data. You’ll intensify safety precautions by reducing speed, expanding escape route margins, and continuously cross-referencing NWS alerts to compensate for reduced environmental awareness.
References
- https://radar.weather.gov/
- https://play.google.com/store/apps/details?id=com.aviatorassistant.weather&hl=en_US
- https://teamrubiconusa.org/news-and-stories/best-hurricane-tracking-apps-and-tools/
- https://weatheralertnow.com/
- https://play.google.com/store/apps/details?id=com.jpltech.hurricanetracker&hl=en_US
- https://climeradar.com/blog/real-time-storm-tracking-clime-guide