Atmospheric pressure is the weight of air pressing down on Earth’s surface, measured in hectopascals (hPa), with standard sea-level pressure at 1,013.25 hPa. When pressure drops below 1,009 hPa, storm conditions activate. A 10 hPa drop in three hours triggers gale-force winds, while a 24 hPa drop in 24 hours signals a weather bomb. Understanding these thresholds gives you 12–24 hours of advance warning before storms escalate into something far more destructive.
Key Takeaways
- Atmospheric pressure is the weight of air above Earth’s surface, measured in hectopascals, with standard sea-level pressure at 1013.25 hPa.
- Low pressure systems form when warm, moist air rises, drawing surrounding high-pressure air inward and generating increasing wind circulation.
- Central pressure dropping below 1,009 hPa confirms active storm conditions, while pressure below 980 hPa intensifies cyclonic rotation significantly.
- A 10 hPa drop within 3 hours generates gale-force winds; a 24 hPa drop in 24 hours signals a weather bomb.
- Monitoring barometric pressure changes provides 12–24 hours of lead time, helping anticipate storm intensity before conditions fully escalate.
What Atmospheric Pressure Actually Is
Atmospheric pressure is the weight of all the air above a given point pressing down on Earth’s surface. You’re fundamentally living beneath a column of atmospheric composition—nitrogen, oxygen, and trace gases—that exerts measurable force at every altitude.
Pressure measurement relies on units like hectopascals (hPa) or millibars (mb), with standard sea-level pressure sitting at 1013.25 hPa. As you move higher in altitude, that overlying air column shrinks, reducing pressure considerably.
Standard sea-level pressure measures 1013.25 hPa—climb higher, and that number drops as the air column above thins.
The Ideal Gas Law ties pressure directly to temperature and density: warmer air becomes less dense, rises, and drops surface pressure. Cooler, denser air sinks and increases it.
Understanding these mechanics gives you the foundation to interpret how pressure shifts drive wind, dictate storm formation, and ultimately shape every weather event you experience.
How High Pressure and Low Pressure Work Against Each Other
When high and low pressure systems clash, you get the pressure gradient—the invisible force that drives wind from areas of higher pressure toward areas of lower pressure. The steeper that gradient, the faster the wind accelerates, and a 3 hPa drop over just 3 hours can trigger thunderstorm conditions.
You’ll find that these battling systems don’t simply coexist; high pressure’s sinking, cloud-suppressing air actively competes against low pressure’s rising, storm-fueling dynamics to determine whether skies clear or conditions deteriorate.
Opposing Forces Drive Weather
High and low pressure systems act as opposing forces that continuously shape weather patterns across the globe. You’ll find that pressure fluctuations between these systems directly drive wind generation and storm development.
When high pressure sinks air outward and low pressure pulls rising air inward, the resulting tension creates atmospheric dynamics that determine your local weather conditions.
High pressure suppresses cloud formation while low pressure fuels it. The greater the pressure difference between two systems, the stronger the winds you’ll experience.
A 10 hPa differential can generate gale-force conditions, while a 24 hPa drop within 24 hours triggers explosive cyclogenesis. Understanding these opposing forces gives you the predictive edge to anticipate severe weather before it arrives.
Pressure Gradients Create Wind
The pressure gradient force—the difference in atmospheric pressure between two points divided by the distance separating them—drives wind directly from high to low pressure zones.
Tighter pressure variation means steeper gradients, accelerating wind dynamics considerably. You can observe this mechanism through four measurable interactions:
- A 4 hPa pressure difference over 100 km generates moderate surface winds near 20 km/h.
- High pressure centers push air outward clockwise in the Northern Hemisphere.
- Low pressure systems pull surrounding air inward counterclockwise, fueling storm rotation.
- Pressure gradients exceeding 10 hPa over short distances produce gale-force conditions.
These aren’t arbitrary thresholds—they’re calculable, predictable forces.
Understanding gradient mechanics gives you genuine insight into storm behavior before it reaches your location.
Battling Systems Shape Storms
Pressure gradients don’t operate in isolation—opposing high and low pressure systems actively compete, and that competition determines storm intensity, track, and duration.
When a dominant high-pressure ridge blocks a low-pressure system‘s path, storm dynamics shift dramatically. The low stalls, intensifying precipitation over fixed regions. Conversely, when high pressure weakens, the low accelerates, pulling moisture rapidly and amplifying winds.
These pressure interactions follow measurable rules. A central pressure below 1009 hPa sustains storm development, while surrounding high-pressure systems dictate steering currents.
You can track this competition through barometric readings—a 10 hPa fall over three hours signals gale-force conditions ahead. Understanding which system dominates gives you predictive power over a storm’s behavior, movement, and ultimate strength before it reaches you.
How Low Pressure Triggers Storm Formation
When surface air warms and rises, it creates a zone of low pressure that sets storm formation in motion. Understanding these storm dynamics gives you an edge in recognizing atmospheric threats early.
Here’s how low pressure drives the process:
- Warm, moist air ascends over ocean surfaces, dropping surface pressure below 1009 hPa.
- Surrounding higher-pressure air rushes inward, accelerating wind circulation.
- Rising air cools rapidly, condensing water vapor into clouds and triggering precipitation.
- Cyclonic rotation develops counterclockwise in the Northern Hemisphere, tightening the system.
Each stage compounds the last. A pressure fall of 3 hPa over three hours can produce thunderstorms.
You’re watching a self-reinforcing engine — and low pressure is its ignition switch.
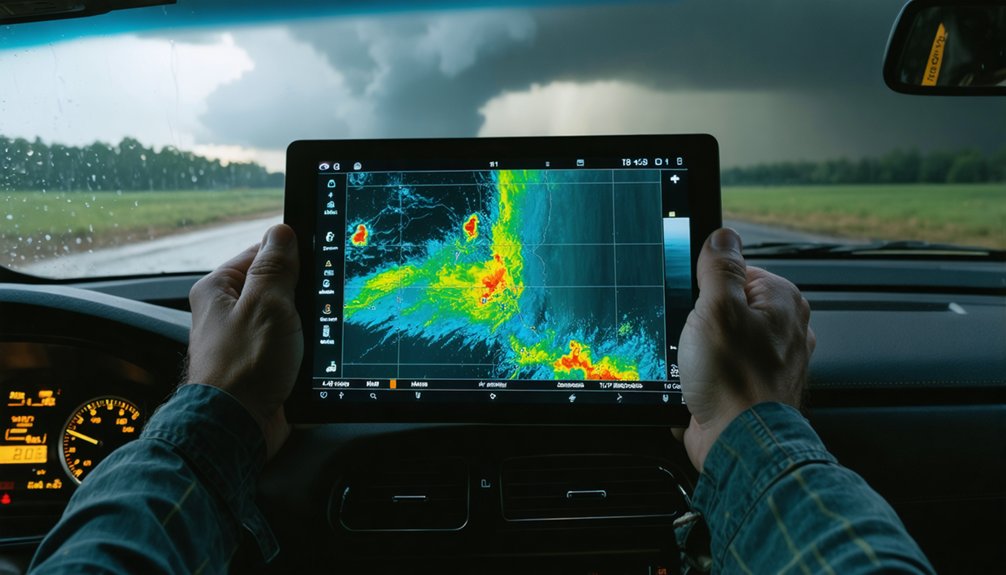
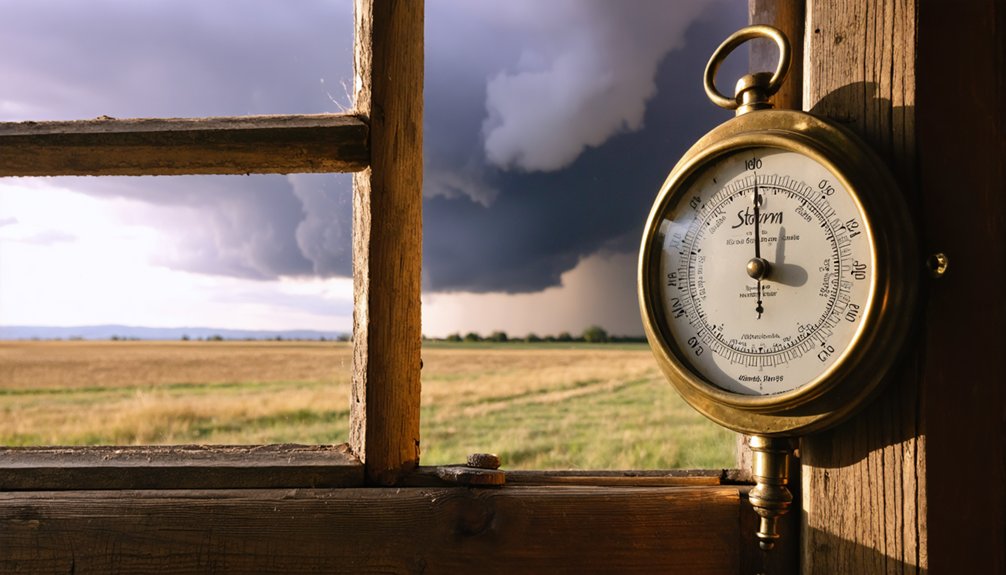
How Barometric Pressure Drops Signal an Approaching Storm
A dropping barometer doesn’t just hint at bad weather — it quantifies it. When you track pressure fluctuations, you gain real predictive power. A 3 hPa fall over three hours signals incoming thunderstorms. Push that to 10 hPa, and you’re facing gale-force conditions. These aren’t arbitrary thresholds — they’re reliable storm indicators grounded in atmospheric physics.
Falling pressure means rising air masses are pulling surface pressure down, accelerating wind inflow and moisture convergence. The faster the drop, the stronger the developing system. A 24 hPa pressure fall within 24 hours at 60° latitude — a weather bomb — drives winds exceeding 77 km/h.
Monitor your barometer actively. A sustained decline over 12–24 hours gives you a critical preparation window before conditions deteriorate.
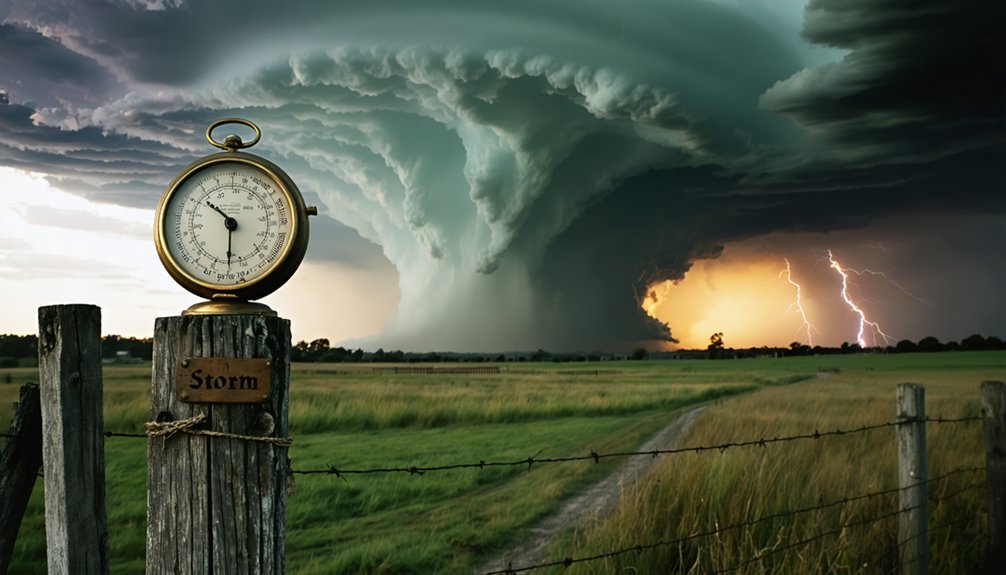
Pressure Thresholds That Define Storm Severity
When tracking storm development, you’ll find that pressure must drop below 1,009 hPa before a system can sustain storm-level intensity.
As pressure falls accelerate, a 10 hPa drop over three hours marks gale-force conditions, while a 24 hPa drop within 24 hours at 60° latitude — the “weather bomb” threshold — drives winds to 77 km/h.
For hurricanes, you can measure intensity directly through central pressure minimums, with sustained winds crossing 74 mph as the eye’s pressure reaches its lowest recorded values.
Storm Pressure Baseline Requirements
Atmospheric pressure thresholds define the boundary between routine weather and storm-force conditions, with systems requiring a central pressure below 1,009 hPa to sustain organized storm activity.
Understanding these storm pressure baseline requirements gives you precise markers for evaluating risk:
- 1,009 hPa — minimum threshold for organized storm development
- 3 hPa drop in 3 hours — triggers thunderstorm formation
- 10 hPa drop in 3 hours — generates gale-force winds
- 24 hPa drop in 24 hours — qualifies as a weather bomb at 60° latitude, producing 77 km/h winds
Once pressure falls below baseline requirements, the system’s intensity scales directly with continued pressure decline.
You’re tracking a measurable, predictable relationship — each pressure drop increment reveals progressively destructive wind energy and storm organization.
Gale And Bomb Thresholds
Two specific pressure thresholds separate ordinary storm conditions from genuinely dangerous wind events: a 10 hPa drop in 3 hours triggers gale-force winds, while a 24 hPa drop in 24 hours — measured at 60° latitude — classifies a system as a weather bomb, generating sustained winds of 77 km/h.
Gale formation occurs when pressure gradients steepen rapidly, forcing air to accelerate sharply between high and low pressure zones.
You’re looking at sustained winds exceeding 62 km/h — enough to compromise structures, disrupt navigation, and limit safe outdoor activity.
Bomb intensity escalates that threat considerably. When a system deepens that fast, it’s fundamentally an explosive cyclogenesis event — pressure collapses faster than most forecasting windows can capture, leaving you with minimal response time.
Tracking these thresholds gives you measurable, actionable warning markers before conditions become unmanageable.
Hurricane Pressure Intensity Markers
Gale and bomb thresholds mark the upper boundary of mid-latitude storm intensity — but hurricanes operate on a different pressure scale entirely, one where central pressure directly dictates destructive potential.
You can track hurricane intensity through these pressure dynamics benchmarks:
- Tropical storm status triggers at 39 mph winds with a defined low-pressure eye forming.
- Hurricane classification begins at 74 mph, with central pressure driving force multiplication.
- Each pressure drop below 980 hPa intensifies cyclonic rotation measurably.
- The lowest recorded central pressures correlate directly with catastrophic Category 5 destruction.
As pressure falls, surrounding air rushes inward faster, accelerating wind speeds exponentially.
When pressure rises, the storm weakens — it’s losing its engine.
Understanding these markers gives you precise, actionable storm intelligence.
Why Hurricanes Need Extreme Low Pressure to Survive
Hurricanes depend on extreme low pressure as their core engine, with the eye typically dropping below 950 hPa and the most intense storms reaching below 900 hPa. This pressure gradient drives hurricane dynamics, pulling surrounding air inward and upward with tremendous force.
When central pressure falls, wind speeds surge proportionally — you’re watching physics enforce itself in real time. Without sustained low pressure, the inflow of warm, moist oceanic air cuts off, starving the storm’s convective engine. The moment pressure rises in the eye, the system weakens.
That’s why land interaction kills hurricanes; it removes the warm ocean surface that maintains the heat-driven pressure differential. You can track intensity directly through pressure readings — lower numbers mean stronger, more dangerous storms demanding serious respect.
What Pressure Changes Reveal About Storm Behavior
Barometric pressure changes give you a direct window into storm behavior before the storm arrives. Tracking pressure fluctuations lets you anticipate intensity, timing, and type.
Watch these thresholds:
- A 3 hPa drop over 3 hours signals incoming thunderstorms.
- A 10 hPa drop over 3 hours generates gale-force winds.
- A 24 hPa drop within 24 hours at 60° latitude produces a weather bomb with 77 km/h winds.
- Sustained falling pressure below 1009 hPa confirms active storm conditions.
You’re reading the atmosphere’s own data feed. Rising pressure means sinking air and storm dissipation. Falling pressure confirms rising air, moisture condensation, and strengthening rotation.
The faster pressure drops, the faster storm behavior escalates—giving you actionable lead time of 12–24 hours.
Frequently Asked Questions
Can Atmospheric Pressure Variations Affect Human Health and Well-Being?
Yes, atmospheric pressure variations directly impact your health. You’ll experience headache triggers, mood changes, sleep disturbances, and respiratory issues when pressure drops rapidly, as falling barometric readings alter oxygen availability and bodily fluid dynamics measurably.
How Do Meteorologists Measure Pressure Changes Aboard Aircraft During Storms?
Think pressure sensors don’t matter? You’d be wrong—meteorologists use onboard pressure sensors to capture real-time barometric data during storm tracking, recording rapid hPa fluctuations that reveal storm intensity, helping you understand exactly how dangerous conditions truly are.
Does Atmospheric Pressure Differ Significantly Between Coastal and Inland Regions?
Yes, you’ll notice coastal pressure typically runs lower than inland pressure. Warm ocean air rises, reducing coastal pressure, while inland regions experience higher pressure from denser, cooler air masses, creating measurable gradients driving onshore winds.
Can Animals Detect Barometric Pressure Drops Before Storms Arrive?
Like nature’s own barometer, yes—animals detect barometric pressure drops before storms arrive. Their animal instincts and pressure sensitivity trigger behavioral changes when pressure falls 3–4 hPa over three hours, warning you before instruments confirm approaching danger.
How Does Atmospheric Pressure Behave Differently at Extreme Polar Latitudes?
At polar latitudes, you’ll find intense pressure gradients driven by the polar vortex, where extremely cold, dense air creates persistent low pressure. These steep gradients fuel powerful winds, delivering unpredictable, freedom-challenging weather systems that differ dramatically from mid-latitude patterns.
References
- https://www.youtube.com/watch?v=2GRORSnsr9A
- https://www.worldstormcentral.co/law of storms/secret law of storms.html
- https://gpm.nasa.gov/education/articles/how-do-hurricanes-form
- https://www.rhinobldg.com/blog/understanding-barometric-pressure-in-hurricanes
- https://scied.ucar.edu/learning-zone/how-weather-works/highs-and-lows-air-pressure
- https://www.pbslearningmedia.org/resource/0025fc4c-2e04-47c6-85f4-62edaec5c68a/air-pressure-and-storms/