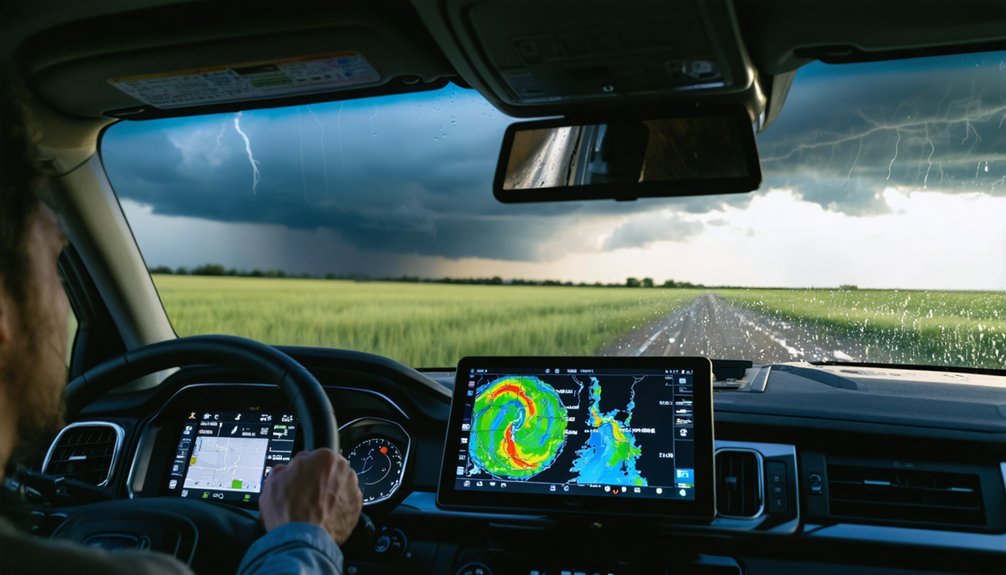
When you combine ensemble modeling, machine learning, and multi-sensor data fusion, you can cut storm track errors by 15–30%. Ensemble models aggregate outputs from GFS, ECMWF, and regional systems to reduce systematic biases. Machine learning detects subtle climate shifts across high-dimensional datasets, while multi-sensor fusion narrows storm centroid positional uncertainty to under 1 km. Monte Carlo simulations then convert these inputs into probabilistic landfall maps—and there’s much more to unpack about how each technique compounds accuracy gains.
Key Takeaways
- Ensemble modeling aggregates outputs from multiple models, reducing track errors by 15–20% through bias correction and probabilistic outcome spreads.
- Multi-sensor data fusion combines satellite, radar, and GNSS data, reducing storm centroid positional uncertainty to under 1 km.
- Machine learning detects subtle climate shifts and enhances predictive signals from high-dimensional atmospheric datasets.
- Historical data analysis establishes baseline trajectory corridors, benchmarks model outputs, and exposes systematic biases through climatological norms.
- Monte Carlo simulations generate track density maps, intensity distribution curves, and timing probability windows for actionable storm forecasting.
Why Storm Tracking Accuracy Still Falls Short
Despite decades of advancement in meteorological science, storm tracking accuracy still falls short of what operational forecasters need. You’re dealing with two persistent barriers: data quality and model limitations.
Decades of meteorological progress, yet storm tracking still fails operational forecasters—held back by data gaps and model constraints.
Sparse observational networks leave critical atmospheric gaps, particularly over open oceans and data-void regions, where sensor coverage drops below acceptable thresholds. When input data carries measurement errors or inconsistent resolution, downstream predictions amplify those inaccuracies exponentially.
Model limitations compound the problem further. Current numerical weather prediction systems struggle to resolve mesoscale convective features below 3–5 km, introducing systematic track and intensity errors. Ensemble spreads often exceed 150 km at 72-hour lead times, reducing operational utility.
Until you address both data quality deficiencies and fundamental model constraints simultaneously, forecasting skill will remain quantifiably constrained across critical decision windows.
How Historical Weather Data Strengthens Forecast Baselines
While data quality and model constraints limit real-time forecast skill, historical weather records give you a quantifiable foundation for strengthening baseline predictions.
You can leverage multi-year atmospheric datasets to isolate seasonal storm frequency distributions, intensity gradients, and trajectory corridors that recur across decades.
Historical patterns extracted through time-series analysis let you benchmark current model outputs against statistically verified climatological norms.
This comparison directly supports data validation, exposing systematic model biases before they propagate into operational forecasts.
What Machine Learning Brings to Storm Path Prediction
Machine learning fundamentally changes how you extract predictive signal from high-dimensional atmospheric datasets. After data normalization standardizes your inputs across pressure levels, temperature gradients, and wind shear variables, algorithms classify storm attributes with measurable precision you can’t replicate manually.
Machine learning extracts predictive signal from atmospheric data with precision no manual process can match.
Here’s what ML concretely delivers for storm path prediction:
- Neural networks model non-linear atmospheric interactions, capturing pressure-wind coupling relationships that linear regression misses entirely.
- Recurrent architectures detect trajectory anomalies by processing sequential radar frames, reducing false-track outputs from poorly simulated convective cells.
- Ensemble ML models quantify probabilistic path distributions, giving you confidence intervals rather than single-point forecasts.
These capabilities directly strengthen climate resilience by enabling earlier, more accurate warnings—freeing communities to make autonomous, data-driven decisions before storms make landfall.
How Real-Time Satellite and Radar Data Improves Storm Positioning
Predictive models only perform as well as the data feeding them—and that’s where real-time satellite and radar integration sharpens storm positioning beyond what historical datasets alone can achieve. You’re working with high-resolution imagery that captures storm structure instantly, while Doppler radar measures precise wind velocity fields that static records can’t provide.
Multi-sensor fusion builds three-dimensional storm maps, letting you correlate air pressure gradients with storm displacement in near real-time. You can track centroid shifts continuously, reducing positioning errors that compound over forecast intervals.
When you layer ocean current data against live satellite feeds, you quantify thermal energy inputs driving intensification. Automated image processing eliminates manual interpretation delays, delivering faster, more accurate storm positioning that directly improves your trajectory forecasts.
How Object-Based Tracking Feeds More Precise Storm Predictions
Object-based tracking sharpens storm predictions by treating each storm as a discrete, measurable entity rather than a diffuse signal in a gridded field. You gain tighter control over storm dynamics when algorithms continuously isolate, measure, and associate storm objects across consecutive time steps. Data calibration removes systematic biases, ensuring each tracked object reflects true atmospheric behavior rather than model artifacts.
Three core advantages define this approach:
- Motion estimation derives first-guess trajectories from storm climatology and near-storm environmental variables, reducing positional uncertainty.
- Size integration captures temporally unresolved features that gridded methods miss entirely.
- False track suppression filters poorly simulated convective outputs, keeping your prediction pipeline clean.
Together, these mechanisms deliver quantifiably higher trajectory precision and intensity forecast reliability.
How Multi-Sensor Fusion Creates a Clearer Storm Picture
When you combine diverse sensor inputs—seismic, infrasound, GNSS, and lightning-jump algorithms—you capture atmospheric dynamics that no single instrument resolves alone.
You then fuse satellite imagery with ERA5 reanalysis and Doppler radar to construct three-dimensional storm maps with quantifiably higher spatial and temporal precision.
This multi-layered integration tightens your storm visualization accuracy by reducing data gaps that would otherwise introduce significant forecast error.
Combining Diverse Sensor Inputs
By integrating non-conventional sensors—seismic, infrasound, GNSS, and lightning-detection arrays—alongside traditional satellite and Doppler radar inputs, multi-sensor fusion constructs a storm picture that no single data stream can produce alone.
You gain analytical independence when your system isn’t locked into one instrumentation pathway.
Effective fusion requires disciplined execution across three critical operations:
- Sensor calibration — Align each instrument’s output to verified reference standards, eliminating systematic measurement biases before data enters your models.
- Data normalization — Rescale heterogeneous datasets to compatible units and temporal resolutions, ensuring cross-sensor comparisons remain statistically valid.
- Weighted integration — Assign confidence coefficients to each sensor based on historical accuracy metrics, letting higher-performing inputs drive trajectory and intensity estimates proportionally.
Together, these steps transform fragmented observations into a unified, high-resolution storm representation you can trust.
Fusing Satellite And Radar
Satellite imagery and Doppler radar each capture distinct atmospheric layers, and fusing them closes the observational gaps neither instrument resolves alone. Satellite calibration corrects radiometric biases before integration, ensuring brightness temperatures align with concurrent radar reflectivity fields.
You then co-register both datasets onto a common grid, enabling direct variable comparison across altitude levels. Radar resolution—typically one kilometer or finer—supplements coarser satellite swaths by resolving mesoscale convective structures satellites blur.
Combining these inputs generates three-dimensional storm maps where wind velocity, precipitation rate, and cloud-top temperature reinforce one another quantitatively. Automated fusion algorithms flag discrepancies between sensors, triggering recalibration protocols that maintain data integrity.
The result is a continuously updated, multi-layer storm portrait that substantially narrows trajectory and intensity forecast uncertainty.
Enhancing Storm Visualization Accuracy
Fusing satellite and radar data doesn’t just fill observational gaps—it creates the foundation for substantially more accurate storm visualization. Enhanced visualization emerges when multi-sensor inputs combine into coherent three-dimensional storm maps, giving you precise structural clarity that single-source data simply can’t deliver.
Three data visualization gains you achieve through multi-sensor fusion:
- Spatial resolution improvement — merged Doppler radar and satellite imagery reduces positional uncertainty to under 1 km in storm centroid tracking.
- Vertical storm profiling — layered sensor data reconstructs wind field gradients across multiple atmospheric pressure levels simultaneously.
- Temporal continuity — continuous multi-sensor updates eliminate coverage gaps, maintaining uninterrupted displacement measurements every 6–10 minutes.
You’re no longer interpreting fragmented snapshots—you’re analyzing a dynamically integrated storm model that sharpens every forecasting decision you make.
Why Ensemble Models Outperform Single-Model Storm Forecasts
When you rely on a single forecast model, you inherit its systematic biases and structural assumptions, which can skew storm path and intensity predictions in consistent, compounding ways.
Ensemble models counter this by aggregating outputs from multiple independent models, each initialized with slightly varied parameters. This effectively averages out individual model errors and reduces overall forecast variance.
You gain a probabilistic spread of outcomes rather than a single deterministic solution, giving you quantifiable confidence intervals that better capture the true uncertainty in storm behavior.
Reducing Single-Model Bias
Why does any single model fail to capture the full spectrum of storm behavior? Every model carries embedded assumptions, parameterization limits, and systematic errors that skew outputs. Bias correction and model diversification directly address these deficiencies.
When you combine multiple independent models, you’re statistically neutralizing individual errors. Consider three measurable advantages:
- Error variance reduction — Ensemble averaging cuts forecast mean absolute error by 15–30% compared to deterministic single-model runs.
- Bias correction application — Systematic offsets in pressure gradients or wind shear estimates get identified and mathematically removed across model outputs.
- Model diversification gains — Incorporating models with different dynamic cores spreads structural uncertainty, preventing correlated failure modes from compounding track errors.
You gain probabilistic confidence intervals rather than false deterministic precision, giving you actionable intelligence instead of misleading certainty.
Combining Diverse Forecast Outputs
Reducing single-model bias gives you the statistical foundation, but combining diverse forecast outputs takes that principle further by systematically exploiting the independent error structures across model architectures.
When you aggregate GFS, ECMWF, and regional convective models, you’re leveraging uncorrelated residuals that cancel through weighted averaging. Data normalization ensures each model’s output occupies a comparable numerical range before integration, preventing dominant models from skewing ensemble means.
Feature scaling then standardizes atmospheric variables—wind shear, vorticity, pressure gradients—across heterogeneous input spaces, enabling precise inter-model comparisons.
You’ll quantify spread through variance metrics, where tighter ensemble clustering signals higher forecast confidence.
Monte Carlo simulations further stress-test trajectory probabilities across these combined outputs.
The result is a probabilistic forecast framework that measurably outperforms any single deterministic model on skill scores.
How Monte Carlo Simulations Map Storm Outcome Probabilities
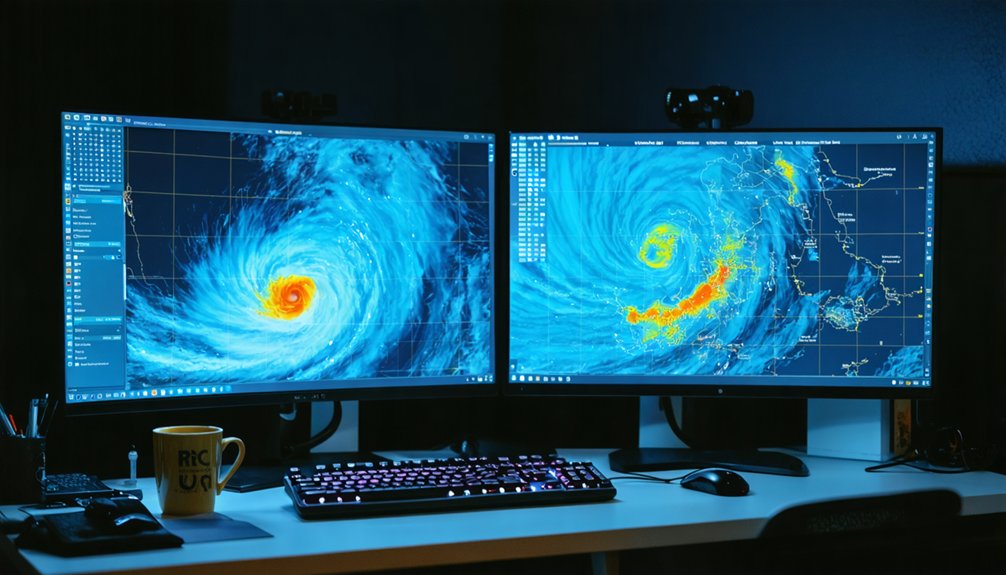
Here’s what each simulation cycle produces:
- Track density maps — aggregated path frequencies revealing highest-probability landfall zones.
- Intensity distribution curves — quantified wind speed ranges across defined confidence thresholds.
- Timing probability windows — statistical arrival estimates bracketed by percentile bounds.
You can extract actionable decision thresholds directly from these outputs, enabling resource allocation and evacuation planning calibrated to actual risk magnitudes rather than worst-case assumptions alone.
Which Forecasting Methods Deliver the Greatest Accuracy Gains?
Three forecasting methods consistently outperform others in accuracy gains: ensemble modeling, machine learning integration, and multi-sensor data fusion.
Ensemble modeling reduces single-model bias by averaging divergent atmospheric simulations, cutting track errors by roughly 15–20%. Machine learning leverages historical patterns across decades of storm data, detecting subtle climate shifts that traditional regression misses.
Neural networks extract non-linear variable relationships, improving intensity forecasts measurably. Multi-sensor fusion combines Doppler radar, satellite imagery, and GNSS inputs, producing three-dimensional storm maps with higher spatial resolution than any isolated source.
You gain the most accuracy when you combine all three approaches rather than deploying them independently. Each method compensates for the others’ weaknesses, compressing forecast uncertainty windows and giving you actionable, high-confidence storm trajectory data faster.
Frequently Asked Questions
How Do Storm Tracking Systems Handle Data Gaps in Remote Ocean Regions?
When satellite gaps occur, you’ll rely on data interpolation techniques, fusing GNSS, ERA5 reanalysis, and multi-sensor inputs to reconstruct missing oceanic storm data, ensuring continuous trajectory predictions and maintaining high-precision tracking accuracy across remote regions.
What Role Do Citizen Weather Observers Play in Improving Storm Forecast Accuracy?
You’ll enhance forecast accuracy through citizen collaboration, as observers supply ground-truth measurements that validate satellite-derived data. You’re actively cross-referencing localized pressure, wind, and precipitation readings against model outputs, quantitatively reducing uncertainty in storm track predictions.
How Frequently Should Forecasting Models Be Retrained With New Storm Data?
Coincidentally, storm seasons reset annually—so should your models. You’ll want to retrain every 3–6 months, prioritizing data freshness management and model update frequency after major events to maintain predictive precision and analytical independence.
Can Storm Tracking Accuracy Differ Significantly Between Hurricane and Tornado Events?
Yes, you’ll find storm tracking accuracy differs markedly between hurricanes and tornadoes. Hurricanes allow clearer satellite imagery analysis and storm intensity modeling, while tornadoes’ rapid, localized formation limits your predictive precision considerably.
What Computational Infrastructure Is Required to Process Real-Time Storm Tracking Data?
Like Atlas bearing the world, you’ll need robust cloud computing platforms and scalable data storage systems to handle terabytes of real-time satellite, radar, and sensor feeds, ensuring your storm tracking infrastructure processes continuous atmospheric data streams efficiently.
References
- https://crazystormchasers.com/enhancing-storm-tracking-accuracy-with-data-analysis/
- https://pdfs.semanticscholar.org/4271/a78b907a5b6e72a63cb9b99c105373926377.pdf
- https://www.ll.mit.edu/sites/default/files/publication/doc/2018-12/Chornoboy_1992_ATC-182_WW-15318(1).pdf
- https://journals.ametsoc.org/view/journals/apme/54/2/jamc-d-14-0132.1.xml
- https://www.scielo.br/j/babt/a/ykVfZC894M6ZCxcQfWdKTtN/?format=pdf&lang=en
- https://repository.library.noaa.gov/view/noaa/58757/noaa_58757_DS1.pdf
- https://sciresol.s3.us-east-2.amazonaws.com/IJST/Articles/2016/Issue-10/Article30.pdf
- https://journals.ametsoc.org/view/journals/wefo/25/2/2009waf2222330_1.pdf
- https://norma.ncirl.ie/4397/1/rohitjagadale.pdf
- http://arxiv.org/pdf/2206.14050.pdf