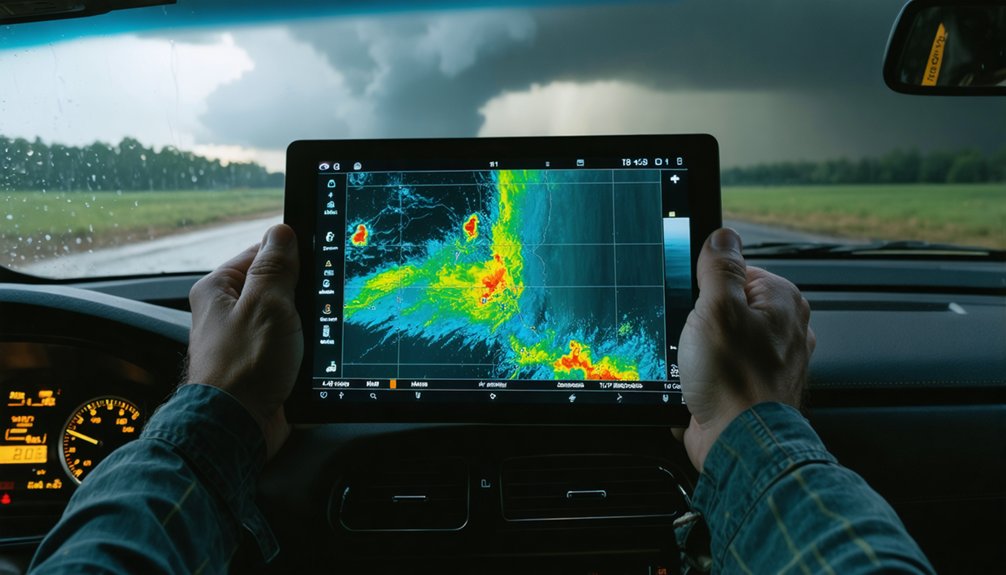
To analyze meteorological data like a pro, you’ll need to calibrate your instruments regularly and standardize collection schedules to guarantee consistency. Clean your data first by applying outlier detection and physical reasonability checks. Integrate satellite, radar, and surface observations for extensive coverage. Use moving averages to reveal trends, apply spatial interpolation for accurate mapping, and validate your models against 30-year climate normals. The tips ahead will sharpen every stage of your workflow.
Key Takeaways
- Regularly calibrate instruments and apply automated validation algorithms to ensure accurate, high-quality meteorological data collection.
- Combine satellite imagery, radar returns, and surface station observations for comprehensive, well-rounded atmospheric analysis.
- Apply moving averages and trend analysis to distinguish long-term climate shifts from short-term seasonal fluctuations.
- Use kriging or inverse distance weighting to transform discrete readings into continuous, spatially coherent interpolated maps.
- Test predictive models against 30-year climate normals and benchmark outputs against observed data for accuracy validation.
Calibrate Your Instruments and Standardize Data Collection
Accurate meteorological analysis starts before you collect a single data point—it starts with properly calibrated instruments. Regularly calibrate your anemometers and barometers to maintain instrument accuracy and eliminate systematic measurement errors before they compound across your dataset.
Standardized data collection protocols are equally critical. You’ll want to schedule observations at consistent times and under comparable conditions to guarantee data consistency across all measurement periods. Inconsistent timing introduces variability that’s nearly impossible to correct during post-processing.
Deploy redundant systems and run parallel measurements whenever possible—this lets you cross-verify readings and catch equipment drift early.
Combine automated validation algorithms with manual reviews to confirm your data reflects actual atmospheric conditions. These disciplined practices establish a reliable foundation for every analytical step that follows.
Clean Weather Data Before You Analyze Anything
Even the most carefully collected meteorological data contains errors, gaps, and inconsistencies that’ll distort your analysis if left unaddressed. Start with completeness checks, removing segments with excessive missing values or irregular time jumps that compromise measurement consistency.
Even pristine meteorological datasets hide errors and gaps that silently corrupt your analysis before it begins.
Apply physical reasonability checks by setting defensible ranges for temperature, humidity, pressure, and precipitation. Values outside those thresholds warrant immediate investigation, not automatic deletion.
Next, run outlier detection algorithms that compare each observation against surrounding historical records to identify systematic biases undermining data accuracy.
When merging multi-source datasets, align them temporally to eliminate asynchronous timing errors.
Finally, apply homogenization techniques to correct disruptions caused by equipment replacements or site changes.
Clean data isn’t optional—it’s the foundation every reliable meteorological analysis depends on.
Integrate Multiple Meteorological Data Sources First
When you’re building a thorough picture of atmospheric conditions, relying on a single data source leaves critical gaps in your analysis. Combine satellite imagery, radar returns, and surface station observations to construct a comprehensive storm understanding that no single source can deliver alone.
Data synchronization is non-negotiable here. Misaligned timestamps across multi-source datasets introduce asynchronous timing errors that corrupt your results. Align each source temporally before merging.
Source validation ensures you’re not amplifying bad data by combining it with good data. Cross-verify readings against parallel measurements, identifying systematic biases between instruments and platforms.
This integration approach gives you analytical freedom—you’re not constrained by one instrument’s limitations or coverage gaps. You control the data’s integrity, resolution, and spatial completeness from the start.
Apply Moving Averages and Trend Analysis to Find Patterns
Raw meteorological data is noisy—short-term fluctuations obscure the underlying patterns you actually need to interpret. Apply moving averages to smooth that noise; a 7-day rolling mean, for instance, reveals temperature trends that daily readings can’t.
Raw meteorological data is noise. A 7-day rolling mean cuts through it, revealing the trends daily readings bury.
Once you’ve smoothed your data, trend analysis becomes actionable. You’ll distinguish genuine long-term shifts from seasonal fluctuations that repeat cyclically each year. Separating these components lets you isolate what’s truly changing versus what’s predictably recurring.
Anomaly detection follows naturally from this framework. When you’ve established a reliable baseline trend, deviations become statistically meaningful rather than visually ambiguous. Flag observations exceeding two standard deviations from your moving average as candidates for deeper investigation.
This disciplined approach transforms raw atmospheric noise into structured, interpretable intelligence you can actually use.
Map Weather Patterns Using Spatial Interpolation
When mapping weather patterns, you’ll want to use kriging to transform discrete station data into continuous temperature maps through spatial interpolation.
For rainfall distribution, inverse distance weighting lets you estimate precipitation levels between observation points with mathematical precision.
You can sharpen your spatial analysis further by integrating satellite imagery, radar data, and surface observations into a unified, multi-source dataset.
Kriging For Temperature Maps
Kriging transforms discrete temperature readings from scattered weather stations into continuous, spatially coherent maps by leveraging statistical correlations between neighboring data points. Unlike simpler interpolation methods, kriging quantifies spatial correlation through variogram modeling, letting you characterize how temperature variability changes across distance.
You’ll define the variogram’s range, sill, and nugget parameters to accurately represent your dataset’s spatial structure. Once calibrated, the algorithm estimates temperatures at unsampled locations while simultaneously calculating prediction uncertainty.
This dual output gives you both interpolated values and confidence intervals, empowering independent validation of your results. You’re not locked into rigid assumptions—kriging adapts to anisotropic conditions where temperature variability differs directionally, such as across elevation gradients.
Mastering this technique gives you genuine analytical control over complex meteorological datasets.
Rainfall Distribution Estimation
While kriging excels at temperature mapping, inverse distance weighting (IDW) offers a computationally efficient alternative for estimating rainfall distribution between observation points. IDW assigns influence to each station inversely proportional to its distance from the target location, letting you construct continuous rainfall surfaces without complex variogram modeling.
You’ll need to account for precipitation variability carefully, since rainfall distributions are inherently irregular compared to temperature fields. High spatial heterogeneity demands denser observation networks, particularly in regions exhibiting rainfall clustering, where localized convective events concentrate moisture within narrow geographic corridors.
Adjust your IDW power parameter strategically — higher values emphasize nearby stations, reducing smoothing artifacts in clustered precipitation zones. Cross-validate your output against withheld station data to quantify interpolation error and confirm your rainfall estimates remain physically defensible across the study domain.
Integrating Multi-Source Data
Combining satellite imagery, radar data, and surface observations lets you build a far more complete picture of storm systems than any single source allows. You’ll need precise sensor synchronization to align timestamps across platforms—even minor offsets introduce errors that cascade through your analysis. Without it, you’re comparing measurements from different atmospheric states.
Data fusion techniques merge these inputs into coherent, high-resolution outputs by weighting each source according to its reliability, spatial resolution, and temporal frequency. Satellite imagery captures broad-scale moisture distribution, radar resolves precipitation intensity, and surface stations anchor everything with ground-truth measurements.
Prioritize consistency in coordinate systems and projection standards before merging datasets. When done correctly, multi-source integration eliminates blind spots, reduces uncertainty, and gives you analytical leverage that no standalone dataset can match.
Test Your Models Against Historical Weather Data

Once you’ve built a predictive model, testing it against historical weather data is non-negotiable for validating its accuracy and reliability. Use comparative analysis to benchmark your model’s outputs against 30-year climate normals, identifying systematic deviations that signal structural weaknesses.
T-tests can quantify whether mean temperature differences between predicted and observed periods are statistically significant, while regression diagnostics expose instability in precipitation forecasts.
Data assimilation strengthens this process by incorporating observed historical records directly into your model framework, reducing uncertainty and improving forecast fidelity.
You’ll also want to evaluate your model’s contribution to climate resilience by appraising how accurately it captures extreme events.
Run backward selection in regARIMA modeling, then scrutinize the diagnostics rigorously.
Precise validation today means sharper, more dependable meteorological insights tomorrow.
Visualize Meteorological Patterns With the Right Software Tools
Visualizing meteorological data effectively demands the right software stack, and choosing it strategically separates rigorous analysis from guesswork. You’ll want platforms that integrate satellite imagery directly into your workflow, enabling seamless overlay of observational station data against broader atmospheric patterns.
Tools supporting zonal statistics let you extract precise regional summaries without manual aggregation.
Zonal statistics eliminate tedious manual aggregation, delivering precise regional summaries exactly where your analysis demands them.
Prioritize software handling data compression efficiently—large-scale temporal datasets degrade performance without it, limiting your analytical freedom.
Multi-dimensional visualization environments let you interrogate spatial autocorrelation, isolate anomalies, and compare variables across simultaneous layers.
Geoprocessing capabilities, including interpolation functions, convert discrete point measurements into continuous surface maps for sharper pattern recognition.
Selecting software that supports automated validation alongside manual review ensures your visualizations reflect verified, high-integrity data rather than propagating preprocessing errors into your final interpretation.
Frequently Asked Questions
How Often Should Meteorological Data Be Archived for Long-Term Storage Purposes?
You should archive meteorological data daily, ensuring robust data retention schedules align with standardized storage formats. Consistent archiving lets you preserve historical patterns, validate long-term climate models, and maintain analytical integrity across extended observation periods.
What Legal Regulations Govern the Sharing of Meteorological Data Between Countries?
You’ll find that international treaties like the WMO agreements govern cross-border meteorological data sharing, while data privacy laws vary by nation. Always verify bilateral agreements and compliance requirements before transferring datasets across jurisdictions.
How Do Weather Analysts Handle Data During Extreme Events Like Hurricanes?
As the storm intensifies, you’d deploy real-time monitoring systems to capture rapid atmospheric shifts. You’ll run continuous data validation checks, cross-verifying redundant sensor inputs against historical baselines, ensuring your measurements remain accurate despite extreme, rapidly evolving hurricane conditions.
What Career Qualifications Are Needed to Become a Meteorological Data Analyst?
You’ll need a degree in meteorology or atmospheric science, strong statistical skills, and proficiency in satellite imagery analysis and climate modeling tools to launch your career as a meteorological data analyst effectively.
How Does Urban Heat Island Effect Impact Local Meteorological Station Readings?
Like a sponge soaking up warmth, urban heat distorts your local station accuracy by artificially inflating temperature readings. You’ll need homogenization techniques to correct these non-climatic biases and guarantee your meteorological data remains reliable.
References
- https://www.noaa.gov/stories/6-tools-our-meteorologists-use-to-forecast-weather
- https://www.youtube.com/watch?v=E_n3Ft4WozM
- https://crazystormchasers.com/how-to-analyze-meteorological-data-effectively/
- https://www.oreateai.com/blog/methods-for-analyzing-meteorological-observation-data/3e9a070275a43f6d8983a3a48b87ab4d
- https://analysisfunction.civilservice.gov.uk/wp-content/uploads/2016/11/Weather-and-Climate-Guidance-version-2-November-2016.pdf
- https://fiveable.me/meteorology/unit-14/data-collection-quality-control-analysis-techniques/study-guide/CJckJeoHaEWOBzQV
- https://medium.com/@kirtikajoshi2426/performing-analysis-of-meteorological-data-e2ed086703d