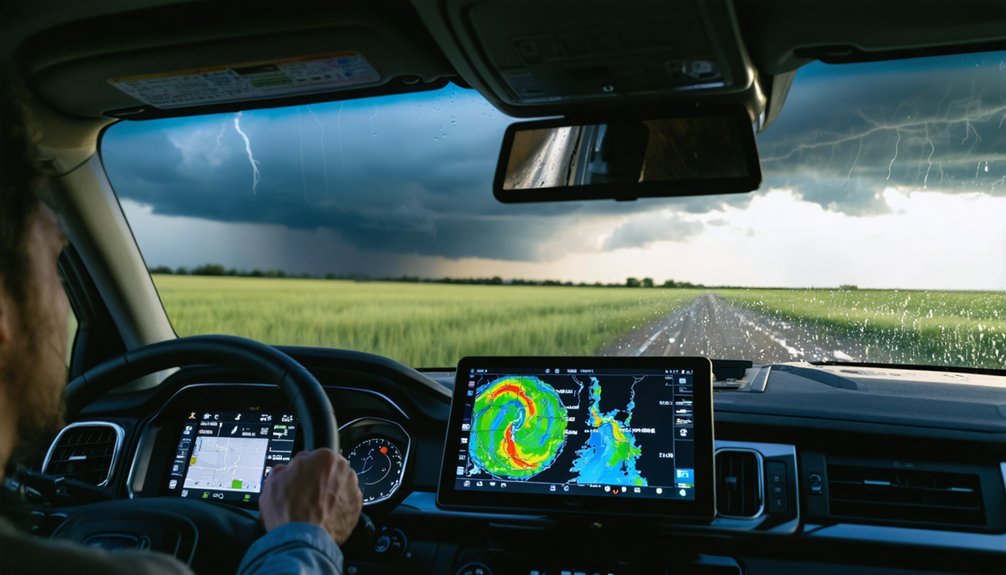
To use GR2Analyst for storm chasing, connect it to the Iowa State Level II feed for real-time and archival NEXRAD data. Load Base Reflectivity to assess storm structure, then switch to Base Velocity to spot tight green-red rotation couplets. Enable Volumetric Mode to build 3D storm models, and pull NWS warnings directly into the interface for situational awareness. Keep your color tables and MDA settings tuned for field conditions. Everything covered below will sharpen your analytical edge markedly.
Key Takeaways
- Connect GR2Analyst to the Iowa State Level II feed to access real-time and historical radar data from NEXRAD sites since 1995.
- Use Base Reflectivity to assess storm intensity and switch to Base Velocity to identify rotation through tight green-red couplets.
- Enable Volumetric Mode to build 3D storm models, then rotate and dissect them using cross-section tools for internal analysis.
- Place storm motion vectors and use warning polygons to track storms, with tick marks indicating 15-minute movement intervals.
- Activate dual-polarization products and tune MDA settings to refine mesocyclone detection and reduce clutter during storm analysis.
Connect GR2Analyst to the Iowa State Level II Feed
To get real-time radar data into GR2Analyst, you’ll need to connect it to the Iowa State Level II feed. This feed delivers consistent, reliable polling that powers accurate radar signal processing across the platform. Navigate to the pulling settings and configure the specific link required for radar data scan retrieval and loading.
Once connected, you’ll unlock access to nearly any weather event since 1995, giving you complete freedom to replay and analyze historical storms on demand. The feed supports both standard and super-resolution Level II data from the NEXRAD network, ensuring high-fidelity data visualization regardless of the event you’re examining.
Dual-polarization products are also available through this connection, providing a comprehensive structural view of storm evolution without switching between external sources.
Which Radar Products to Use and When in GR2Analyst
With GR2Analyst connected and streaming data, choosing the right radar product for each situation is what separates effective storm analysis from guesswork.
Start with Base Reflectivity for radar signal interpretation — it shows precipitation intensity and helps you map storm structure visualization quickly.
When you suspect rotation, press V to switch to Base Velocity and look for that classic couplet indicating a potential tornado.
Storm Relative Velocity removes storm motion from the equation, giving you cleaner airflow data relative to the moving cell.
Use Spectral Width to gauge turbulence levels, and pull up Echo Tops when you need the storm’s vertical extent.
Each product answers a different question — cycling through them deliberately keeps your analysis sharp and your situational awareness accurate.
How to Read Base Reflectivity and Velocity in GR2Analyst
When reading Base Reflectivity, you’ll interpret color-coded returns where higher values in the red-to-purple range indicate intense precipitation and potential hail cores.
To detect rotation, press the V key to activate Base Velocity, which displays inbound and outbound wind speeds relative to the radar site.
A tight couplet of contrasting colors — typically red adjacent to green — signals rotation within the storm and warrants immediate attention as a possible tornadic signature.
Reading Base Reflectivity Intensity
Understanding what you’re seeing on the Base Reflectivity display is essential for interpreting storm intensity. Base Reflectivity measures returned energy from precipitation, displaying it as color-coded dBZ values across the radar sweep.
Reflectivity patterns reveal critical storm intensity data through these thresholds:
- 20–30 dBZ – Light rain or drizzle
- 40–50 dBZ – Moderate to heavy rain
- 50–60 dBZ – Very heavy rain, possible hail
- 60+ dBZ – Large hail, severe thunderstorm conditions
You’ll identify the strongest storm cores by targeting deep reds and purples on the display. A tight, compact high-dBZ core surrounded by a steep reflectivity gradient typically signals a powerful, organized updraft.
Monitoring how reflectivity patterns evolve over successive frames helps you assess whether a storm is intensifying, weakening, or maintaining its current structure.
Detecting Rotation Via Velocity
Look for adjacent green and red returns in close proximity — this color contrast signals rotation detection. Green indicates winds moving toward the radar; red indicates winds moving away.
When these opposing values appear tightly coupled within a supercell, you’re identifying a mesocyclone or potential tornado signature.
Also watch for velocity divergence, where winds spread outward from a central point, indicating outflow boundaries or downdraft-driven spread.
The tighter and more intense the couplet, the stronger the rotational signature — prioritize this product when evaluating tornadic potential.
Build a 3D Storm Model With GR2Analyst Volumetric Mode
GR2Analyst’s Volumetric Mode lets you generate a complete 3D model of any storm, giving you a structural view that standard 2D cuts can’t provide. Enabling this feature elevates your storm visualization by integrating full volume scan data across all available tilt angles.
To build your 3D model effectively:
- Enable Volumetric Mode from the toolbar to initiate full 3D rendering of the storm structure.
- Rotate and dissect the model to expose internal dynamics invisible in standard 2D sweeps.
- Cut the storm open using cross-section tools to inspect composition and updraft regions.
- Use dual-polarization data alongside volumetric rendering for a detailed structural breakdown.
You’re not limited to flat radar slices anymore. Volumetric Mode puts complete storm architecture at your fingertips, letting you analyze from any angle independently.
Set Up Storm Motion Tracking in GR2Analyst

Accurate storm motion tracking is essential for generating reliable storm tracks and ETAs in GR2Analyst. To set it up, right-click the center of your target storm to place a marker, then advance several frames and place a second marker.
Select “Storm Motion from Marker” from the context menu, and the program calculates direction and speed automatically using its built-in tracking algorithms.
Alternatively, right-click any active warning polygon and choose “Storm Motion from Warning” to pull motion data directly from National Weather Service parameters.
If neither option fits, manually enter storm motion values through the toolbar’s input window.
Once you’ve configured your storm motion vector, loop the data to confirm it accurately reflects real movement before building tracks or estimating arrival times.
How to Use the Storm Track Tool for ETA Estimates
Use the tick marks to estimate ETAs:
- Each tick mark represents a 15-minute interval along the projected path.
- Compare image time with tick mark positions to estimate arrival at a target location.
- Loop the data to verify the track aligns with actual storm movement.
- Select Remove Storm Track to clear the display when finished.
Accurate storm speed input is non-negotiable for reliable forecast accuracy and confident chase decisions.
Pull NWS Warnings Directly Into GR2Analyst
When a warning drops, you don’t need to leave GR2Analyst to read it — just click directly on the warning box displayed on the radar. The full NWS text feed loads instantly inside the program, keeping your workflow uninterrupted and your eyes on the data.
GR2Analyst also renders hail icons, MDA icons, and OSR icons tied to each active warning, giving you layered situational awareness without switching platforms. This tight integration supports faster, independent decision-making — critical when you’re operating in the field with limited time.
Behind the scenes, data compression optimizes how warning polygons and associated metadata load alongside your radar scan. Pair this with proper radar calibration settings, and every warning you pull reflects accurate, timely information you can act on immediately.
Configure Color Tables, VIL, and MDA Settings for Field Use
Customizing GR2Analyst’s color tables, VIL thresholds, and MDA parameters lets you tailor the software’s output to your specific operational needs. Color calibration guarantees critical features stand out during high-pressure field scenarios, while data normalization keeps your readings consistent across varying radar inputs.
- Modify color tables to match your brand or highlight specific reflectivity thresholds for faster visual scanning
- Access Algorithm Settings to configure VIL calculations, adjusting sensitivity based on your target storm environment
- Tune MDA Settings to refine mesocyclone detection parameters for more precise rotation identification
- Apply custom color scales that separate weak returns from significant threats without visual clutter
These configurations travel with your setup, giving you full control over how radar data renders when decisions matter most.
Load and Replay Historical Radar Events in GR2Analyst

To replay historical radar events in GR2Analyst, you’ll need to connect to the Iowa State Level II feed, which provides reliable access to nearly any weather event recorded since 1995.
Once connected, configure your pulling settings to retrieve the specific radar data link required for scan retrieval and loading.
From there, you can load the event directly into the program and begin immediate replay and analysis.
Connecting To Iowa State
GR2Analyst connects directly to the Iowa State Level II feed, giving you access to nearly any weather event recorded since 1995. This connection powers both radar signal processing and data visualization, letting you pull historical scans on demand.
To configure your connection:
- Navigate to the polling settings and enter the Iowa State Level II feed URL
- Set the retrieval parameters to target the specific radar site you need
- Enable super-resolution support to maximize data fidelity during download
- Confirm dual-polarization products are active for complete storm structure access
Once configured, you’re no longer dependent on live conditions to study significant events. You can load archived data instantly, replay it frame by frame, and apply every analytical tool GR2Analyst offers — full control, no restrictions.
Loading Historical Weather Events
Once your connection is configured, loading historical weather events is straightforward — you can pull nearly any radar event recorded since 1995 directly into GR2Analyst for immediate replay. This gives you unrestricted access to decades of storm data without relying on satellite imagery or external archives.
To load an event, navigate to the data retrieval menu and specify your target radar site, date, and time range. GR2Analyst handles data compression automatically, so large volumetric scans download and render efficiently without manual optimization.
Once loaded, you can loop the event, step through individual scans, and analyze storm structure at your own pace.
This historical playback capability lets you study past tornadoes, supercells, and severe weather episodes with the same precision tools available for live data analysis.
Configuring Radar Data Settings
Before pulling radar data, you’ll need to configure GR2Analyst’s settings to point to the correct data source. Proper radar calibration and data synchronization guarantee you’re working with accurate, real-time or archival scans.
Navigate to the polling settings and configure the following:
- Data source: Connect to the Iowa State Level II feed for consistent radar data retrieval
- Resolution type: Select standard or super-resolution NEXRAD Level II data depending on your analysis needs
- Pull link: Set the specific retrieval link targeting your desired radar site and scan type
- Dual-polarization toggle: Enable dual-pol products to access full storm structure data
Once configured, GR2Analyst will synchronize incoming data streams accurately, letting you load events dating back to 1995 without feed interruptions or misaligned scan sequences.
Frequently Asked Questions
Can Gr2analyst Run on Mac or Is It Windows Only?
GR2Analyst’s software compatibility is strictly Windows-only — Mac users are completely locked out of its powerful user interface. You’ll need a Windows machine to unlock its full storm-chasing radar analysis capabilities freely.
Does Gr2analyst Require a Paid Subscription or License to Use?
GR2Analyst isn’t free — you’ll need to purchase a license to access its full features. Check Gibson Ridge’s official site for current subscription cost details and available licensing options that fit your storm analysis needs.
What Are the Minimum System Requirements for Running Gr2analyst Smoothly?
You’ll need a Windows-based PC with sufficient RAM, a modern GPU, and a stable internet connection for system compatibility. Keep software updates current to guarantee GR2Analyst runs smoothly during critical storm analysis sessions.
Can Gr2analyst Display Lightning Strike Data Alongside Radar Products?
GR2Analyst doesn’t natively support lightning data radar integration, but you can overlay third-party lightning strike feeds using external tools alongside your radar products to enhance your storm analysis and situational awareness considerably.
Is Gr2analyst Suitable for Beginner Storm Chasers With No Radar Experience?
GR2Analyst can overwhelm yet empower you simultaneously. You’ll master radar interpretation through hands-on exploration, using Base Reflectivity and Velocity products. Storm tracking tools guide your learning, giving you freedom to analyze real events independently.
References
- https://www.youtube.com/watch?v=vB4kCH4VzPU
- https://www.facebook.com/groups/grlevelx.radarscope.user.group/posts/1587926685113503/
- https://www.weather.gov/media/top/GR for Dummies 2.70.pdf
- https://www.youtube.com/watch?v=0lEZqEGyCcg
- https://weatherzone411.com/gr2analyst/
- https://www.youtube.com/watch?v=klRKcBuon4Y
- https://www.youtube.com/watch?v=unlXtiGNeYs