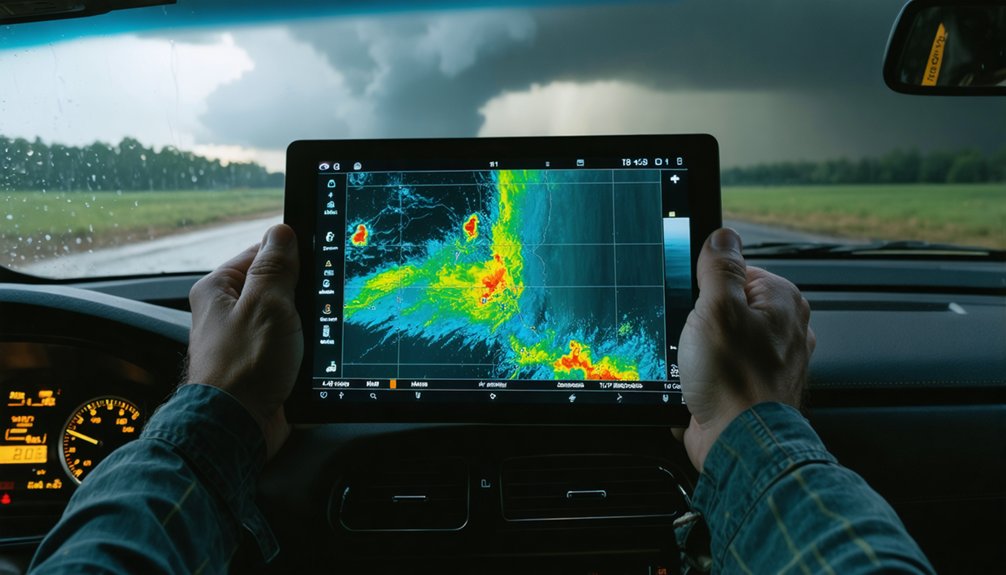
When you’re chasing storms, GIS lets you layer radar returns, satellite imagery, wind vectors, and humidity fields into one unified spatial framework. You can track precipitation patterns, estimate storm speed, and pull live data from NOAA’s nowCOAST WMS feeds directly into platforms like ArcGIS or QGIS. It’s not just visualization—it’s real-time decision intelligence. Everything covered here only scratches the surface of what GIS can do for your storm analysis workflow.
Key Takeaways
- GIS integrates satellite imagery, radar, temperature gradients, and wind vectors into one spatial framework for comprehensive storm analysis.
- NOAA provides GIS-ready shapefiles, KML/KMZ, and GRIB2 formats, while nowCOAST streams real-time WMS meteorological data.
- Tools like ArcGIS, QGIS, and GRLevel3 enable full integration of radar and atmospheric data layers.
- Historical hurricane track datasets help identify recurring storm development zones and flag matches with current conditions.
- During intercepts, GIS calculates storm motion vectors and overlays radar onto road networks for safe escape routing.
What Makes GIS So Valuable for Storm Chasing?
Because storm systems evolve rapidly across large geographic areas, you need a tool that integrates multiple data streams into a single spatial framework—and that’s exactly what GIS delivers.
GIS advantages extend beyond simple mapping—you’re layering satellite imagery, radar returns, temperature gradients, humidity fields, and wind vectors simultaneously, giving you a complete operational picture.
Storm tracking becomes precise when you can visualize precipitation patterns, estimate storm speed and direction, and overlay historical datasets to identify recurring development zones.
Precise storm tracking means visualizing precipitation, mapping movement, and recognizing where history says development happens again.
Platforms like ArcGIS, QGIS, and GRLevel3 let you pull real-time WMS feeds alongside GPS spotter positions, collapsing multiple workflows into one interface.
You’re not guessing where a storm is heading—you’re analyzing spatial relationships that reveal exactly how a system is behaving and where it’s moving next.
Key GIS Data Sources Storm Chasers Actually Rely On
Storm chasers draw from several core data sources that each serve a distinct spatial function in the field. NOAA delivers GIS-ready files in shapefile, KML/KMZ, and GRIB2 formats, giving you structured layers you can drop directly into your platform.
The nowCOAST project streams real-time WMS services, keeping your situational picture current as conditions shift. You’ll also pull from historical datasets through NOAA’s Historical Hurricane Tracks tool to identify recurring development zones and refine your positioning strategy.
Remote sensing and ground-based instruments expand your coverage beyond what any single network provides.
Crowdsourced reports from GPS-equipped spotters feed real-time position data and significant weather observations into platforms like Spotter Network, filling spatial gaps that automated sensors miss. Combining these sources gives you a complete, actionable operational picture.
The Best GIS Tools for Real-Time Storm Tracking
When you’re tracking an active storm, your toolset determines how fast you can process spatial data and act on it. GRLevel3 delivers raw radar files in vector format with direct GIS layering abilities, giving you precise real time visualization of developing cells.
ArcGIS and QGIS support full data integration across radar, satellite, and surface observation layers. RadarScope and RadarOmega provide mobile-grade severe weather monitoring with responsive spatial rendering.
Spotter Network plots GPS-confirmed chaser positions, strengthening situational awareness across your operational area. NOAA’s nowCOAST WMS feeds push live meteorological layers directly into your GIS platform.
For predictive modeling and emergency response coordination, combining these tools into one spatial workflow lets you track storm kinematics, estimate speed and direction, and make faster, better-informed decisions independently.
How GIS Maps Storm Patterns Before They Strike
Before a storm ever forms, GIS is already building the spatial context you need to recognize it. You layer historical hurricane tracks, atmospheric moisture grids, and wind shear maps to identify where conditions align for storm development. That spatial overlap reveals repeating setup signatures—patterns that precede severe weather across similar geographic zones.
Weather visualization tools let you animate these variables across time, so you’re not reacting to a static snapshot. You’re watching a sequence unfold. When current atmospheric data matches a historical storm trajectory pattern, GIS flags the convergence spatially before conventional forecasting confirms it.
You’re pulling from NOAA shapefiles, GRIB2 model output, and radar-derived precipitation trends simultaneously. That multi-layer analysis gives you a predictive edge—identifying where a storm is likely to track before it ever organizes.
How GIS Reduces Risk During Active Storm Intercepts
Once you’re actively intercepting a storm, GIS shifts from predictive tool to real-time decision engine. You’re pulling live radar feeds, GPS spotter positions from Spotter Network, and WMS layers from NOAA’s nowCOAST platform simultaneously.
That data accuracy lets you calculate storm motion vectors, identify escape routes, and avoid getting boxed in by rotating cells.
Tools like GRLevel3 overlay Level-II radar directly onto road networks, giving you spatial context that raw data can’t provide alone.
RadarScope and RadarOmega extend that capability to mobile platforms, keeping you informed when you’re moving fast.
Storm safety depends on how quickly you process spatial inputs and act. GIS compresses that decision window by consolidating radar, geography, and live observer reports into one integrated, navigable display you control entirely.
Frequently Asked Questions
What GIS File Formats Are Compatible With NOAA Hurricane Datasets?
You’ll find GIS file compatibility with NOAA data formats includes shapefiles, KML/KMZ, and GRIB2, enabling seamless storm dataset integration and hurricane data visualization across platforms like ArcGIS and QGIS for powerful spatial analysis.
Can Crowdsourced Spotter Reports Be Integrated Directly Into GIS Platforms?
Coincidentally, yes—you can integrate crowdsourced data directly into GIS platforms via Spotter Network’s GPS feeds. You’ll navigate integration challenges around report accuracy, but real-time updates strengthen your spatial-analytical storm-tracking workflow considerably.
How Does GIS Handle Positional Errors in Statistical Storm-Track Modeling?
When you’re applying statistical storm-track methods, you’ll trade slight positional accuracy losses for longer, structured paths. GIS can’t eliminate error mitigation gaps entirely, but it strengthens statistical reliability and refines your storm modeling outputs spatially.
Which GIS Platforms Support Level-Ii and Level-Iii Radar Data Imports?
Cutting to the chase, ArcGIS and GRLevel3 support Level-II and Level-III radar data imports. You’ll tackle import challenges through spatial analysis, platform comparison, and data visualization tools, empowering your user interface experience with freedom-driven meteorological insights.
How Does Noaa’s nowCOAST Project Deliver Real-Time GIS Data Streams?
You’ll access NOAA’s nowCOAST project through WMS services, delivering real-time tracking of live meteorological layers directly into your GIS platform. It’s your gateway to unrestricted data visualization, letting you stream, map, and analyze weather conditions spatially, on demand.
References
- https://crazystormchasers.com/incorporating-gis-in-meteorological-data-analysis-for-storm-chasing/
- https://en.wikipedia.org/wiki/Storm_chasing
- https://journals.ametsoc.org/view/journals/apme/47/5/2007jamc1673.1.xml
- http://www.diva-portal.org/smash/get/diva2:1223673/FULLTEXT01.pdf
- https://www.weather.gov/ddc/chaser
- https://www.nhc.noaa.gov/gis/
- https://ttu-ir.tdl.org/bitstreams/1f061fdd-b833-486b-b84a-8a8732dbfbb0/download
- https://www.stormchasingusa.com/blog/learning-the-basics-about-tornadic-storm-forecasting/
- https://proceedings.esri.com/library/userconf/proc01/professional/papers/pap1113/p1113.htm
- https://scispace.com/pdf/a-gis-methodology-for-the-analysis-of-weather-radar-3iyai8w5uu.pdf