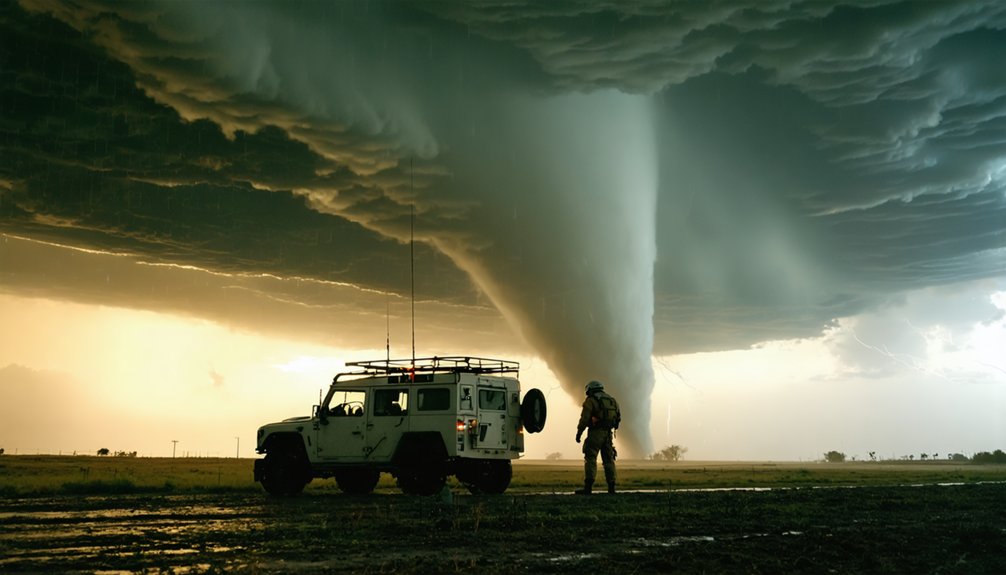
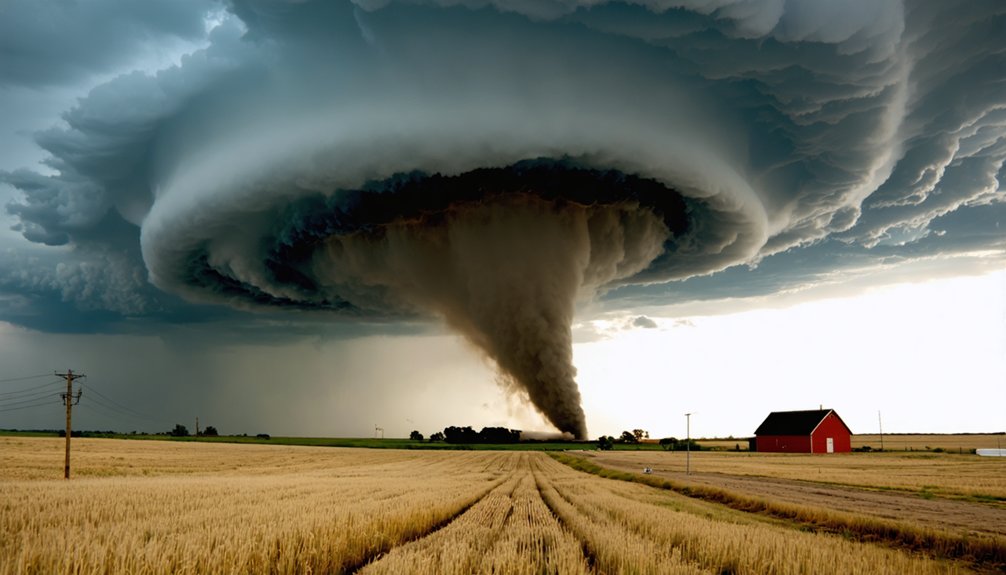
Dixie Alley is measurably more dangerous than Tornado Alley, even though both regions see comparable annual tornado counts. Dixie Alley accounts for over 60% of U.S. tornado fatalities, driven by nighttime strikes, rain-wrapped storms, dense tree cover, and slab-foundation homes without basements. You’re 2.5 times more likely to die in a tornado between midnight and dawn, which is exactly when Dixie Alley storms frequently hit. The full picture reveals why tornado count alone tells you almost nothing about actual risk.
Key Takeaways
- Dixie Alley accounts for over 60% of U.S. tornado fatalities despite producing similar annual tornado counts to Tornado Alley.
- Over one-third of Dixie Alley tornadoes strike between 9 pm and 7 am, when residents are asleep and least prepared.
- Dense tree cover and rain-wrapped tornadoes in Dixie Alley severely limit visibility, making early detection nearly impossible.
- Most Dixie Alley homes lack basements, and high mobile home prevalence leaves residents with few safe shelter options.
- Dixie Alley experiences tornadoes year-round across fall, winter, and spring, eliminating any predictable safe season for residents.
What Is Tornado Alley vs Dixie Alley?
Tornado Alley and Dixie Alley are the two most tornado-prone regions in the United States, but they differ sharply in geography, storm behavior, and human risk.
Tornado Alley spans the central Great Plains, covering Texas, Oklahoma, Kansas, Nebraska, South Dakota, Iowa, and Missouri, with peak activity concentrated in April through June. Tornado prediction models were historically built around this region’s open terrain and defined seasonal patterns.
Dixie Alley stretches from Louisiana through Mississippi, Alabama, Tennessee, and into Georgia. Historical climate data shows tornado activity shifting east-southeast since 1979, making Dixie Alley increasingly relevant.
Unlike Tornado Alley‘s single peak season, Dixie Alley sees dangerous conditions across fall, winter, and spring.
Understanding both regions gives you a clearer picture of where true tornado risk concentrates across the country.
Where Does Each Region Start and Stop?
Knowing where each region begins and ends sharpens your understanding of why storm risk varies so dramatically across the country.
Tornado Alley spans from the Texas Gulf Coast northward through Oklahoma, Kansas, Nebraska, and into South Dakota, with Dallas, Wichita, and Oklahoma City anchoring its core.
Historical data places Iowa and Missouri along its eastern edges.
Dixie Alley stretches from Louisiana eastward through Mississippi, Alabama, Tennessee, Arkansas, Georgia, and into the Carolinas.
Meteorological patterns confirm this corridor sits close enough to Gulf moisture to fuel year-round storm development rather than a concentrated spring season.
Neither boundary is rigid.
Both regions reflect shifting atmospheric conditions, and tornado activity has been trending east-southeast since 1979, gradually expanding Dixie Alley‘s influence relative to the traditional Plains corridor.
Which Region Sees More Tornadoes Each Year?
When you compare annual tornado counts, you might expect Tornado Alley to dominate, but both regions actually produce comparable numbers each year.
What makes the comparison more complex is the eastward shift in tornado activity that’s been occurring since 1979, gradually making Dixie Alley more active relative to the Plains.
During certain climate cycles like La Niña, Dixie Alley’s frequency can even approach or exceed Tornado Alley’s totals.
Annual Tornado Count Comparison
Both regions produce comparable annual tornado counts, though Tornado Alley has historically edged ahead in raw frequency. However, that gap is narrowing.
Since 1979, tornado activity has been shifting east-southeast, making Dixie Alley increasingly active relative to the Plains. During La Niña cycles, Dixie Alley’s annual frequency can approach or even exceed Tornado Alley’s totals.
This shift demands updated urban planning strategies across southeastern communities. You can’t rely on outdated assumptions about where tornado threats concentrate. Emergency preparedness frameworks must reflect current data, not historical patterns from decades ago.
Tornado Alley still holds a higher probability of producing EF5 tornadoes annually, but Dixie Alley compensates with more frequent severe outbreaks. Raw tornado counts alone don’t define danger — intensity, timing, and exposure complete the picture.
Shifting Activity Trends
Since 1979, tornado activity has been shifting east-southeast, gradually eroding Tornado Alley’s historical dominance in raw frequency counts.
Historical climate data confirms this eastward migration isn’t a temporary fluctuation—it’s a measurable, sustained trend reshaping where you face the greatest risk.
During La Niña cycles, Dixie Alley’s annual frequency can approach or exceed Tornado Alley’s totals, compressing your decision-making window considerably.
Urban infrastructure in southeastern cities like Birmingham and Memphis wasn’t designed around tornado preparedness the way Plains communities structured theirs decades ago.
This shift matters because frequency alone doesn’t define danger. You’re now looking at a region gaining tornado activity while simultaneously lacking the shelter infrastructure, visibility conditions, and warning response culture that Tornado Alley developed over generations of exposure.
Why Tornado Count Is a Misleading Danger Metric
Tornado count alone doesn’t tell you which region is actually more dangerous. Raw frequency ignores the metrics that actually threaten your survival. Dixie Alley produces fewer tornadoes than Tornado Alley, yet it leads the nation in per-capita fatalities.
Historical tornado patterns reveal that Dixie Alley’s storms strike at night, wrap in rain, and move through dense tree cover, stripping you of every natural warning advantage. Meanwhile, Tornado Alley’s open terrain and daylight-dominant season give you time to react.
Dixie Alley storms hunt at night, hidden in rain — Tornado Alley’s open skies at least let you see them coming.
Emergency preparedness also differs sharply by region. Plains states offer basement shelters; Dixie Alley communities rely heavily on mobile homes with zero structural protection.
The percentage of tornadoes causing death or injury is markedly higher in Dixie Alley, proving that danger isn’t measured in storm count alone.
Why Dixie Alley Tornadoes Are Harder to See Coming
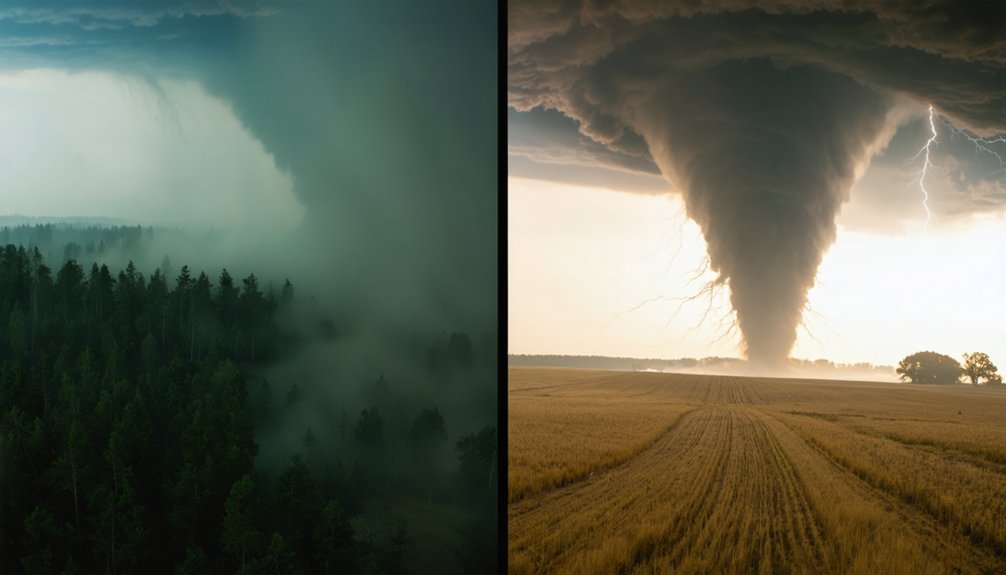
When a tornado forms inside a rain-wrapped supercell, you can’t see it coming until it’s nearly on top of you — a contrast to the open sightlines across Tornado Alley’s flat plains.
Dense tree cover throughout the Southeast compounds this problem, blocking your line of sight and cutting your warning window to seconds rather than minutes.
More than one-third of Dixie Alley’s killer tornadoes strike between 9 pm and 7 am, meaning you’re likely asleep when the storm arrives, making an already invisible threat statistically 2.5 times more lethal than it would be in daylight.
Rain-Wrapped Storm Concealment
One of the most dangerous characteristics of Dixie Alley tornadoes is their tendency to hide inside heavy rain, making visual detection nearly impossible until the storm is already on top of you. Unlike the open Plains where you can spot a funnel from miles away, Dixie Alley’s rain-wrapped storms eliminate that critical visual warning window entirely.
Storm tracking becomes considerably harder under these conditions. Radar limitations compound the problem—standard radar often can’t distinguish the tornado’s circulation from surrounding precipitation, leaving even trained spotters without reliable confirmation.
You can’t rely on sight, and you can’t always trust the data arriving in real time. This combination of concealment and technological constraint makes Dixie Alley’s rain-wrapped tornadoes measurably more lethal than their visually exposed Great Plains counterparts.
Dense Tree Cover Obstruction
Rain-wrapped storms aren’t the only visibility threat working against you in Dixie Alley. Dense tree cover across the Southeast creates a natural obstruction that eliminates your sightlines entirely.
Unlike the open plains of Tornado Alley, where you can spot a funnel miles away, Dixie Alley’s urban forestry and tree preservation culture means thick canopies surround your home, your roads, and your escape routes.
That vegetation blocks your ability to visually detect an approaching tornado until it’s dangerously close. By the time you see it through the trees, your reaction window has collapsed.
Combined with nighttime storms and rain-wrapped circulation, this terrain feature compounds every other risk factor working against you. In Dixie Alley, the landscape itself becomes part of the threat equation.
Deadly Nighttime Visibility Challenges
Darkness eliminates your last reliable defense against an approaching tornado. In Dixie Alley, meteorological patterns consistently produce nighttime tornado outbreaks, stripping away visual detection entirely. Over one-third of Dixie Alley’s killer tornadoes strike between 9 PM and 7 AM while you’re asleep. You’re 2.5 times more likely to suffer fatal injuries between midnight and dawn than during daylight hours.
Unlike Tornado Alley’s open plains where you can visually track funnel clouds, Dixie Alley combines darkness with rain-wrapped storms and dense tree cover, making visual identification nearly impossible. Emergency preparedness becomes your only viable defense mechanism.
You can’t rely on seeing what’s coming. Weather alert systems, NOAA radios, and smartphone notifications aren’t optional equipment here — they’re the difference between survival and becoming part of the fatality statistics.
How Nighttime Storms Make Dixie Alley Far Deadlier
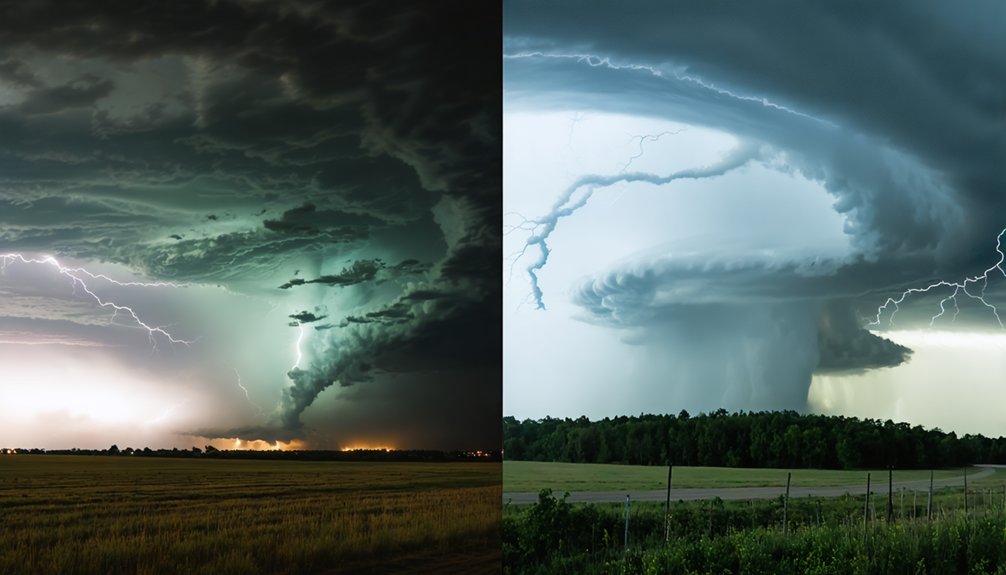
While Tornado Alley’s peak storm activity unfolds during daylight hours in late spring, Dixie Alley’s tornadoes frequently strike overnight when residents are asleep and warnings go unheard. Meteorological patterns in the Southeast produce dangerous storms across fall, winter, and spring, eliminating any predictable safe season you can plan around.
The data is stark: over one-third of Dixie Alley’s killer tornadoes strike between 9 pm and 7 am. You’re 2.5 times more likely to suffer fatal injuries between midnight and dawn than during daylight hours.
Rain-wrapped storms hide rotation inside heavy precipitation, making visual detection nearly impossible.
Emergency preparedness becomes your only reliable defense. Without basement shelters and with mobile home prevalence high, your survival depends entirely on functioning warning systems reaching you while you’re still conscious to act.
Why Dixie Alley Homes Offer Far Less Protection
Surviving a nighttime tornado warning only matters if your home can protect you once you act on it—and in Dixie Alley, it often can’t. Construction vulnerabilities define the region’s housing stock.
Unlike Tornado Alley, where basements provide critical below-grade shelter, most Dixie Alley homes sit on slab foundations with no underground refuge. You’ve got nowhere to go when EF2+ winds arrive.
Compounding this, communities across Mississippi, Alabama, and Tennessee carry disproportionately high concentrations of mobile homes—structures that FEMA classifies as unsafe in any tornado event.
More than 60% of recent tornado fatalities occurred in Dixie Alley, partly because shelter options simply don’t exist.
Emergency preparedness efforts must account for these structural realities, not assume residents have access to protection that the region’s housing inventory doesn’t provide.
Which Region Has the Higher Fatality Rate Per Capita?
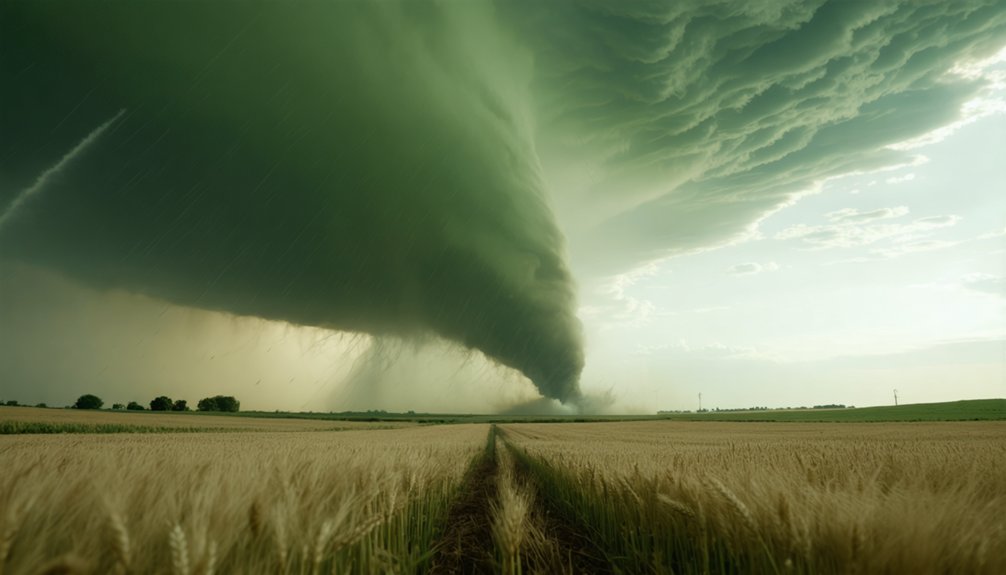
When comparing per capita fatality rates, Dixie Alley leads the nation—and it’s not particularly close.
Historical tornado patterns show that despite producing fewer total tornadoes than Tornado Alley, Dixie Alley consistently records higher deaths per capita. Over the last five years, more than 60% of U.S. tornado fatalities originated there.
Dixie Alley produces fewer tornadoes yet claims more than 60% of U.S. tornado fatalities.
Regional climate influences drive year-round storm windows across fall, winter, and spring—eliminating any predictable safe period. You’re not dealing with one concentrated season; you’re facing persistent, rotating threats across multiple months.
Nighttime timing, rain-wrapped storms, mobile home prevalence, and scarce basements compound the risk dramatically. The percentage of tornadoes causing death or injury is statistically higher in Dixie Alley than in Tornado Alley, making it the deadlier region by nearly every measurable human-risk metric.
Frequently Asked Questions
Does Dixie Alley Have a Defined Tornado Season Like Tornado Alley Does?
Unlike Tornado Alley’s defined April–June peak, Dixie Alley doesn’t give you a single tornado season. You’ll face tornado frequency threats year-round, with seasonal variability spanning fall, winter, and spring, keeping you perpetually on alert.
Which Climate Patterns Cause Dixie Alley Tornado Activity to Increase Significantly?
During La Niña cycles, you’ll see Dixie Alley’s tornado activity spike considerably. Climate variability drives atmospheric instability across the Southeast, pushing annual frequency to levels that can match or exceed Tornado Alley’s totals during these climate phases.
Are Long-Track Tornadoes More Common in Dixie Alley Than Tornado Alley?
Like a serpent refusing to let go, yes—long-track tornadoes are more common in Dixie Alley. Alabama exemplifies this, complicating tornado prediction and emergency preparedness, as storms grind across dozens of miles while you’re often asleep.
How Does Population Density in Dixie Alley Compare to Tornado Alley States?
Dixie Alley’s higher population density means you’re facing greater risk, as it drives more fatalities than any Plains state except Texas. Your emergency preparedness and urban planning decisions directly impact survival when tornadoes strike densely populated southeastern communities.
Has Tornado Activity Been Shifting Away From Tornado Alley in Recent Decades?
Yes, you’re seeing a real shift. Since 1979, tornado frequency has been moving east-southeast, with climate impact driving more activity into Dixie Alley. This trend’s giving you reason to reconsider traditional assumptions about where danger concentrates.
References
- https://www.reddit.com/r/tornado/comments/1jhq8ds/is_it_me_or_does_dixie_alley_seem_worse_than/
- https://en.wikipedia.org/wiki/Dixie_Alley
- https://survive-a-storm.com/blog/tornado-alley-vs-dixie-alley-a-comparison/
- https://www.steadfaststormshelters.com/blog/dixie-alley-map
- https://www.reddit.com/r/tornado/comments/1bkz59n/dixie_alley_vs_tornado_alley/
- https://www.ecoflow.com/us/blog/tornado-alley-vs-dixie-alley-differences-safety
- http://nwafiles.nwas.org/digest/papers/2010/Vol34No2/Pg145-Gagan-etal.pdf
- https://vortexintel.app/explained/tornado-alley-vs-dixie-alley
- https://www.youtube.com/watch?v=xVkCw2swTsE
- https://www.cnn.com/2016/03/30/weather/southeast-tornado-experiment-vortex-se